Truckload capacity has been tight all year, but we’re finally starting to see some easing from the June peak. On the top 100 van lanes, freight volumes declined by more than 7% last week compared to the previous week. Only 18 lanes had higher rates, while 76 went lower and 6 were neutral.
Rates responded to the lower volumes. The national average van rate dropped 5 to $2.33 per mile, which is still 1 higher than the June average.
Chart here
Hot Van Markets
Los Angeles and Houston are still moving strong volumes, but the Midwest is slow. Hot Markets: Rates were down in almost every major market, but Buffalo dipped the least, slipping by an average of less than 1%. There were, however, a few lanes with healthy price increases. The Pacific Northwest had been the weakest region for outbound rates, but last week the rate from Seattle to Stockton, CA, was up 17¢ to an average of $1.49/mile, a sign that the Northwest is starting to stabilize. Buffalo to Chicago increased 16¢ to $2.06/mile, and the return trip is our hot lane of the week: Chicago to Buffalo gained 10¢ to hit $3.32/mile. Falling: The Southeast saw lower rates last week, with prices declining out of Atlanta, Charlotte and Memphis: Atlanta to Charlotte plunged 45¢ to $3.15/mile Atlanta to Chicago fell 25¢ to $2.12/mile Memphis to Charlotte dropped 26¢ to $2.65/mile Charlotte to Allentown was down 25¢ to $3.19/mile And Charlotte to Chicago declined 24¢ to $2.19/mile
********************Van rates edged up another penny last week, to $2.31 per mile for the month to-date. Yet the national average load-to-truck ratio dropped 11% to 9.2 loads per truck. Rate trends typically follow load-to-truck ratios, but in the past two weeks, the ratios are drifting slowly back to earth while rates head in the opposite direction.
Why are rates rising when load-to-truck ratios are falling? For starters, we need to remember that 9.2 loads per truck is a very high ratio, even for the middle of June. It’s 64% above last year’s June average of 5.6, which was the highest-ever ratio at the time. Even with the churn in load board activity, however, there was not a big change in the number of loads moved by the end of the week. In our weekly analysis of the Top 100 lanes by spot market volume, the traffic has been steady even as rates rise on two-thirds of those routes.
Meanwhile, shipper-direct contract rates are up 20% compared to June 2017, including fuel, but spot market rates are 28% higher than last year. For vans, that means carriers get paid about the same for contract or spot hauls this June, while spot rates actually exceed contract rates for reefers and flatbeds. Rail intermodal might seem like an attractive alternative for shippers, but there’s not a lot of headroom there, due to scarce drayage capacity and other service challenges.
So, while you can expect spot market rates to peak in June, they’re likely remain elevated through the end of the year. Sure, we could see some seasonal adjustments in July and August, but the big retail freight season could start as early as mid-September, and in recent years that intense demand has stretched through December and beyond.
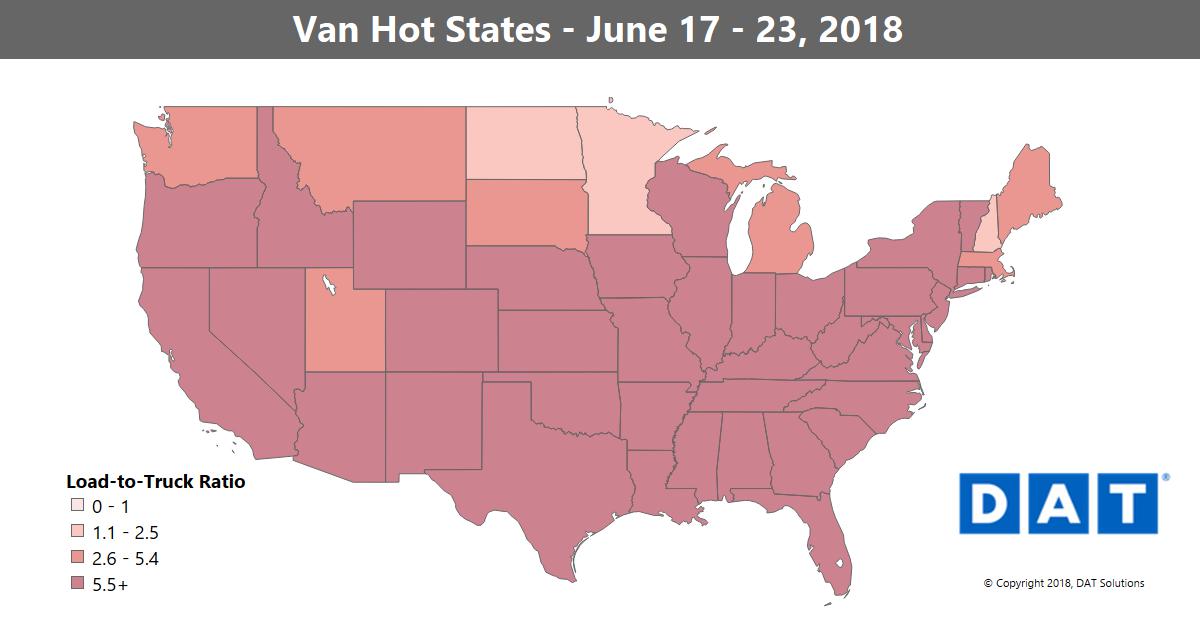
Truck capacity is loosening, but strong demand for van equipment keeps rates and load-to-truck ratios at or near historic levels as the spot market builds to a June peak. The map depicts outbound load-to-truck ratios for dry vans in the 48 contiguous U.S. states, and darker colors correspond to higher ratios. The load-to-truck ratio represents the number of loads posted for every truck posted on DAT load boards. The ratio is a sensitive, real-time indicator of the balance between demand and capacity, and changes in the ratio typically signal impending changes in freight rates.
Hot Van Markets
Los Angeles regained the top spot in freight volumes last week, overtaking Dallas. The Stockton market also had a bump, and demand is strong throughout California. The Southeast region is also in play, with rates increasing in Charlotte and Atlanta. Los Angeles leads in the average outbound rate per mile at $3.09/mile, followed by Memphis at $3.05/mile.
All rates below include fuel surcharges and are based on real transactions between brokers and carriers.
Rising Lanes
Some of last week’s lanes with rising prices included:
- Atlanta to Chicago rates jumped up 21¢ to $3.72/mile. The northbound lane has remained higher than the southbound Chicago to Atlanta lane for several weeks, which is very unusual.
- Los Angeles to Chicago rose 25¢ to $2.03/mile. This rail competitive lane usually moves at much lower rates, signaling that the rails are becoming saturated.
- Several regional rates climbed, including Seattle to Spokane, which added 22¢ to $3.51/mile.
Falling Lanes
There were few lanes of any significance that experienced falling rates, but here are three:
- The lane from Buffalo to Columbus fell 20¢ to $2.17/mile (however, the lane from Columbus to Buffalo rose 21¢).
- Houston to New Orleans cooled after three weeks of extreme highs, dropping 15¢ to a still-very-high $3.17/mile.
- Memphis to Indianapolis dropped 19¢ to $2.97/mile.
Find loads, trucks and lane-by-lane rate information in DAT load boards, including rates from DAT RateView.


