A long-overdue agreement was reached February 20 on contract terms between the International Longshore and Warehouse Union (ILWU) and the Pacific Maritime Association. The labor agreement is not yet ratified by union members, and bumps in the road could still materialize — as this week’s troubles in Oakland demonstrate. Still, the cargo backlog has begun to move from the seven West Coast ports into the supply chain at an increased rate.
Port watchers have estimated that it could take months to clear the docks, which means the peak spot market spring season will kick in before those volumes have been absorbed. The timing of Chinese New Year also plays a role, as ships from China held up during February will now be arriving at both coasts with higher volumes of imports to support the yearly inventory build. Those of us who monitor truckload capacity issues are wondering whether all of that demand will lead to a repeat of last year’s truck shortages and record highs in spot market rates.
Focus on Los Angeles and Long Beach
The main focus of all this watching and waiting is the combined mega-port of Los Angeles and Long Beach, which are the two largest sea ports in North America. Despite the area’s large population and the variety of freight that moves in and out of the Los Angeles metro area, port traffic exerts a very strong influence on local and regional freight trends.
The port component is so pronounced that when freight began to move at the ports in late February, it was apparent in DAT Load Boards and visible on the Hot Market Maps display. The first indicator was a surge in the outbound load-to-truck ratio for vans from the Los Angeles market. The ratio went from 0.3 to 2.2 within a week, and has remained at 1.7 so far in March. By comparison, the freight market of Norfolk, VA is running at a load-to-truck ratio in a range from 10.8 to 16.9 so far this week. The heightened demand for trucks in Norfolk reflects congestion at that port, which has been handling diverted cargo in addition to the normal seasonal volume.
DAT Hot Market Map (March 10) depicts increased demand for outbound vans in the L.A. market, which includes the ports of L.A. and Long Beach.
The load-to-truck ratio is a measure of demand vs. available capacity on the spot freight market. The math is simple: divide the number of loads being offered in a specific location by the number of trucks that are available in the same place. The ratio is a remarkably sensitive indicator, and it often serves as a bellwether that anticipates changes in truckload rates.
In October, the outbound load-to-truck ratio for vans in in Los Angeles peaked at 6.7, meaning 6.7 loads were being offered for every available truck. That’s a high ratio for vans, so truckload rates climbed as load providers tried to entice truckers to move the freight. The ratio began to fall sharply in November, however, when crane activity slowed down at the L.A. and Long Beach ports. Ships waited in berths or anchored offshore. Freight moved again in fits and starts until all Christmas retail merchandise was en route to its final destination. By early January, as the port slowdown took hold, demand for outbound freight transportation from the L.A. market fell off a cliff.
L.A. Became “Dead End” for Trucks in Off-Season
One characteristic of a “normal” freight market in Los Angeles is that outbound rates are higher than inbound rates — in other words, it’s a head haul market. During January and most of February, however, the inbound rates were rising, as load providers needed to incentivize truckers to enter what had become a near dead-end market. The load-to-truck ratio in L. A. was actually lower than the ratio in Miami for several weeks during the off-season. L.A. became a place where trucks faced a likelihood of deadheading out, sometimes as far as Las Vegas or Phoenix, to find eastbound freight. A 250- or 350-mile deadhead is hardly an attractive proposition at any time of the year.
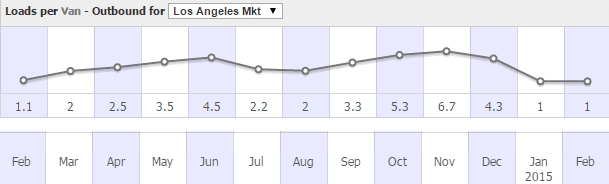
L.A. outbound load-to-truck ratios in January and February fell below one load per truck (rounded up) but they are recovering in March.
Beginning last summer, some of the cargo was diverted via the longer Panama Canal route to ports on the East Coast. Knowing that the multi-year labor contract for West Coast port workers was set to expire on July 1, shippers tried to avoid risk of a strike. Load-to-truck ratios began to rise in New York-New Jersey, Norfolk, Savannah, and other East Coast port cities, through the end of 2014 and early 2015, while spot market freight in Los Angeles plummeted. Rates also dropped for outbound loads all along the West Coast, as truckers broadened their load searches to include much of California and neighboring states, many settling for whatever they could haul, regardless of low rates and deadhead miles.
Labor Agreement Spurs West Coast Truckload Demand
The situation has changed since the contract was (tentatively) resolved. On Feb. 26, within days of the agreement, outbound lanes from Los Angeles were running at a load-to-truck ratio of 1.3, up from 0.3. That ratio is not robust by any means — the national average in the same week was 2.7 loads per truck — but it is evidence of a rapid improvement for truckers. Likewise, ratios out of Ontario, CA edged up to 0.8 from 0.4, while Seattle improved from 0.9 to 2.6 loads per truck.
The amount of available freight increased day by day. For instance, on DAT Load Boards, Los Angeles volume sequentially measured 608 load posts on Feb. 24; 771 posts on Feb. 25; 976 on Feb. 26; and 1,616 on Feb. 27. This adds up to compelling evidence that the labor agreement had an immediate impact on freight volume.
Meanwhile, back on the East Coast, demand for freight transportation was well above the national average: Charleston, S.C. had a load-to-truck ratio of 6.8 in the same period, and outbound demand vs. capacity in Norfolk hit as high as 10.2 loads per truck.
Clearing Backlog May Overlap Seasonal Volume Increase
How soon can we expect “normal” conditions to resume in port cities on both coasts? It will be months until all the backlogged containers are offloaded from ships, drayed to warehouses and unloaded for transfer to an over-the-road truck. Add time for customs clearance, and you get a potential 25- to 41-day time lag, which overlaps the start of spring shipping volumes. Even then, we may need to revise our notion of what is “normal” at the ports.
By mid- to late April, fruit and vegetable harvests will be well underway in California and the Southeastern U.S., filling refrigerated (“reefer”) vans and driving up rates. Plus, additional pressure is expected this year from increased import traffic. According to Global Port Tracker, U.S. containerized imports are expected to jump almost 17% in March, compared to last year, as retailers bring in spring and summer merchandise from Asia.
Los Angeles is regaining some of its luster as an outbound headhaul market. Rates are rising fast, and may remain elevated for months to come. To stay on top of the rapidly changing market conditions and their impact on capacity and rates in your lanes, consult DAT RateView at least once per week.