Current trends in freight can be explained by looking at the top ten contract markets by the proportion of contract vs. spot freight. For the last six weeks, rates have been sliding on the spot market despite strong volumes for the January-February period. The culprit may well be weakness in contract markets in the Southwest region of the United States.

Top markets for van freight
For van freight, the top two contract markets are in southern California. Los Angeles is #1 and Ontario is #2 for the most outbound loads in 2016. The top two markets for spot market freight are Chicago at #1 and Los Angeles at #2. For the markets with the highest ratio of contract freight to spot market freight you will find Flagstaff, AZ, Albuquerque, NM, and San Diego, CA.

Perhaps it’s not a big surprise that the Southwest has a higher percentage of contract freight. Many of the leading contract carriers, including Swift, Knight, and C. R. England depend on longhaul freight out of the West.
Top markets for refrigerated freight
Refrigerated freight trends also impact van markets. When refrigerated freight slows, the trucklines that haul it compete with dry van carriers, often by offering lower rates on dry freight than van carriers. While modern reefer units offer the same cubic capacity as vans, they have somewhat less ability to scale heavy loads and the metal floors of reefer trailers are unsuitable for certain van loads that need blocking and bracing.

Checking out the top ten refrigerated markets, we again find a RateView-defined southern California market at #1: Ontario, CA. The Ontario market encompasses the Inland Empire District, Coachella and Imperial Valleys of California. This market has been slow to get underway for leafy greens this winter. The adjacent market, which includes Yuma, AZ, has been plagued with mildew problems, cutting produce yields. Heavy rainfall, flooding, and landslides in the region haven’t helped.
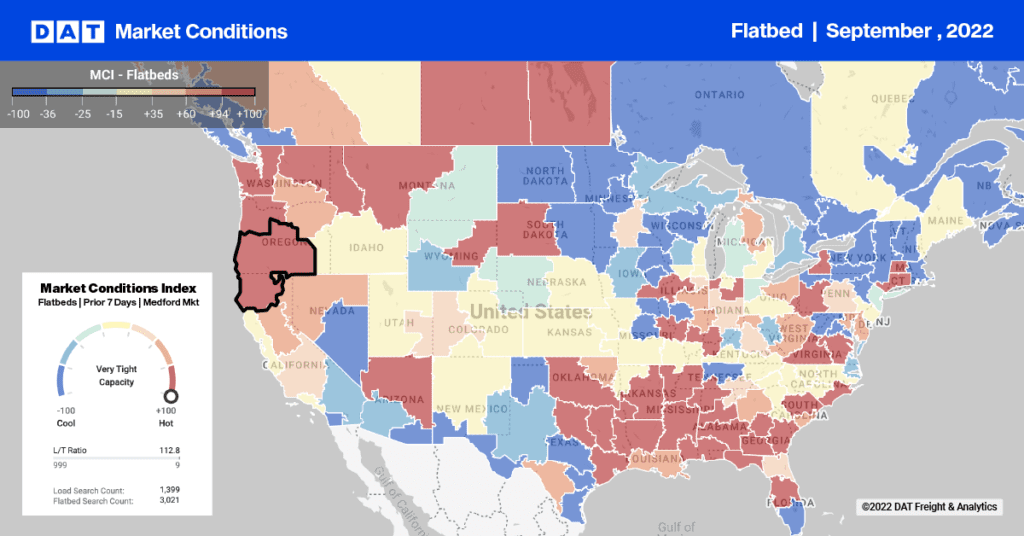
Top markets for flatbed freight
I also took a look at where the most flatbed loads originate. The finding here is that Texas and the Midwest play most prominently in the flatbed segment. None of the top ten flatbed contract markets are in the West. Los Angeles ranks #8 for spot market flatbed loads, behind Houston, Dallas, and Fort Worth in Texas; also behind Chicago, Cleveland, and surprising South Bend, IN in the Midwest.

Flatbed freight has been the clear winner so far in 2017 for improvement in load-truck ratios and rates. It’s also defining the regions, as the eastern half of the country has held up better lately than the West, which is dominated more by van and refrigerated freight.
NOTE: In January we posted the top 10 markets for load posts for each trailer type in 2016. Those lists differ from the ones above because they were based on load posts only, while these represent actual transactions as compiled in DAT RateView. Locations are the key market area (KMA), which is a collection of 3-digit ZIP code areas that are influenced by a major city. To learn more about DAT RateView, click here.