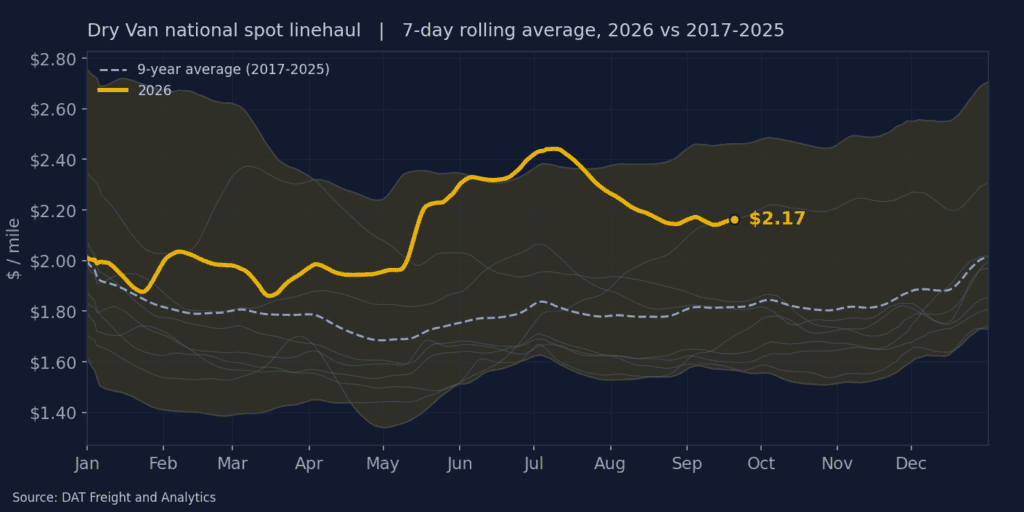
Dry van spot linehaul rates paid to carriers averaged $2.17 per mile last week, minus fuel, unchanged from the week before. Rates climbed 31.9%, or $0.52 per mile, year over year and held 18.5%, or $0.34 per mile, above the nine-year seasonal average of $1.82 per mile, near the top of the historical range.
All rates cited are linehaul only. They exclude fuel costs and surcharges unless otherwise noted.
Get the clearest, most accurate view of the truckload marketplace with data from DAT iQ.
Tune into DAT iQ Live, live on YouTube or LinkedIn, 10am ET every Tuesday.
Bellwether states
Across the dry van bellwether states, the moves-weighted outbound rate came in at $2.91 a mile, easing 0.4%, or $0.01 a mile, from the week before last and running 38.7%, or $0.81 a mile, above a year ago. Those states carried 35.6% of the country’s outbound dry van loads last week, down slightly from 35.7% the week before last and 35.4% a year ago — in line with the roughly 35% share the group usually holds.
Regional rate trends
| Dry Van — Top 10 Origins by Rate Per Mile · Week Ending September 25, 2026 | ||||
|---|---|---|---|---|
| Rank | Origin Region | Avg RPM | WoW % | YoY % |
| 1 | Great Lakes | $2.66 | +0.0% | +38.1% |
| 2 | Ohio River | $2.62 | -0.9% | +38.3% |
| 3 | California | $2.49 | +2.1% | +32.1% |
| 4 | Upper Atlantic | $2.32 | -0.6% | +39.8% |
| 5 | Lower Atlantic | $2.27 | -1.9% | +37.7% |
| 6 | Lower Midwest | $2.26 | -0.6% | +28.0% |
| 7 | Southeast | $2.19 | -1.2% | +35.4% |
| 8 | Carolinas | $2.18 | -0.8% | +34.9% |
| 9 | South Central | $1.98 | -0.6% | +24.0% |
| 10 | Florida-So Georgia | $1.43 | +0.5% | +28.0% |
The top 10 outbound markets accounted for 87.8% of dry van loads moved last week, and every one of them held well above its year-ago level, with gains ranging from roughly 23% to 39%. California put in the strongest week-over-week showing, up 2.1%, or $0.05 a mile, to $2.49 — the only origin in the top 10 to gain more than a percentage point.
Market conditions

Van load posts rose 1.9% week over week and 29.7% year over year last week — the only equipment type to add volume on the week. Equipment posts fell 2.9% and remain 25.8% under a year ago, extending the supply drawdown that has defined 2026. With freight advancing as capacity thinned, the load-to-truck ratio firmed to 11.40 from 10.86.
Short-term outlook

The 35-day DAT Rate Forecast places dry van spot near $2.14 a mile by late October, inside a confidence band of about plus or minus $0.08 a mile, or 3.6% of the forecast — the widest band of the three equipment types DAT iQ tracks. That endpoint sits about $0.46 a mile above the actual rate on this date last year, when dry van ran $1.68 a mile, so the year-over-year premium holds even as week-to-week movement settles.