Produce rates firmed again last week as the load pool thinned. Total refrigerated produce volume fell 9% week over week and 4% year over year, according to the USDA Produce Truck Rate and Volume Report for the week ending Tuesday, October 13. Washington apple and pear lanes led the rate board at an average 72% above last year, followed by California at 44%, South Texas at 41%, and Delmarva at 35%.
Rates cited come from the USDA Produce Truck Rate and Volume Report. They are open-market spot rates per load, including brokers’ fees, and exclude extra charges for terminal delivery and multi-pickup or multi-drop shipments unless otherwise noted.
Get the clearest, most accurate view of the truckload marketplace with data from DAT iQ.
Tune in to DAT Market Update, Mondays at 11am Eastern.
Rates and volume
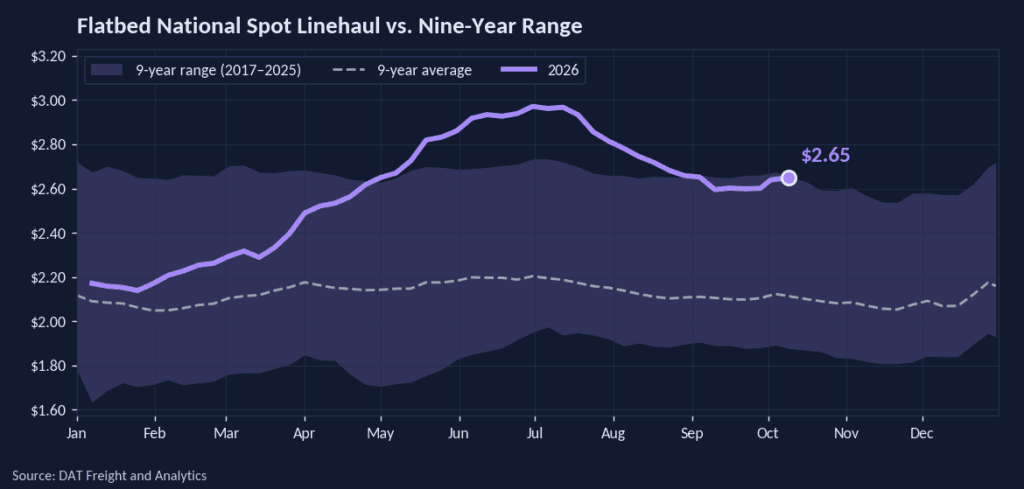
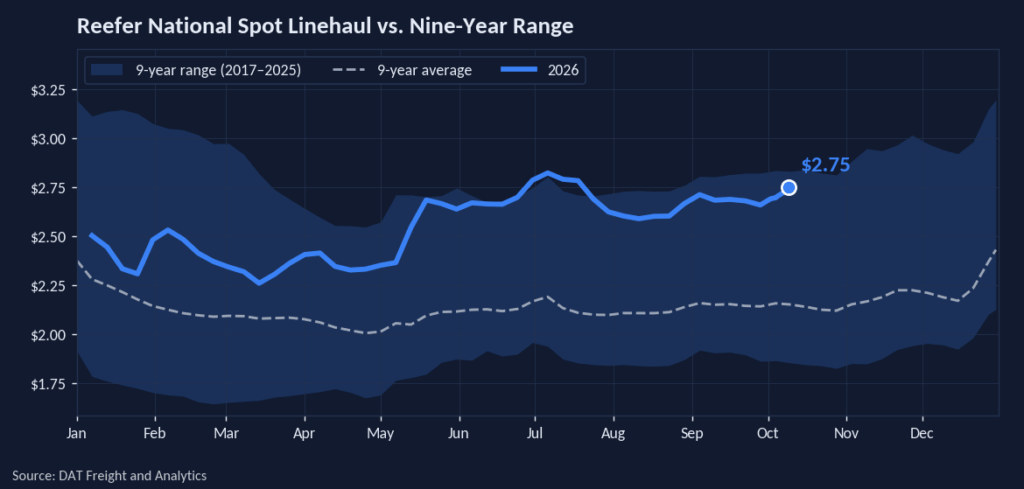
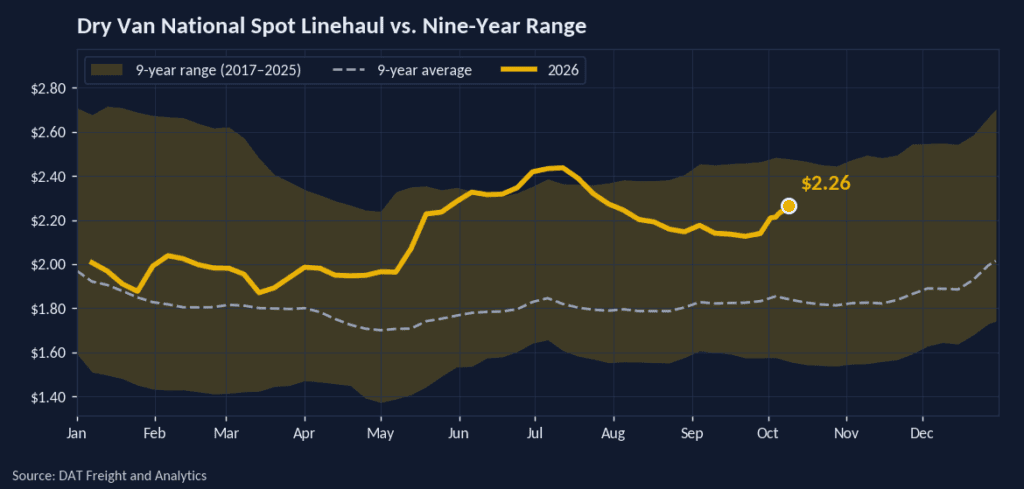
Rates rising while volume slips is consistent with a tighter market, and DAT RateView bears it out. Refrigerated spot rates across all temperature zones and commodity types are running about 35% higher year over year and sit only 5 cents per mile below their 2020 level, when the pandemic-driven capacity crunch was taking hold. The two reads are independent: the USDA data covers produce-only refrigerated freight near 34 degrees, while RateView spans all temperature zones from frozen to fresh.
Nationwide, watermelon volume fell 45% week over week, cantaloupes 25%, cucumbers 22%, and avocados 20%. California posted the broadest rate gains: every lane out of Kern, Oxnard, Salinas, Santa Maria, and the South and Central vegetable basket rose 1% to 11% week over week, and the Imperial lane into Chicago jumped 13%.
State scorecard

States are ranked by total weekly volume. Rate figures are simple averages of each state’s lane movements.
California
California volume, the largest on the board, fell 11% week over week and 4% year over year. Otay Mesa crossings, which count toward the state total, fell 16% week over week and 14% year over year.
Volume through the Imperial and Coachella valleys, Arizona, and Mexicali crossings fell 20% week over week, led by asparagus, down 60%, and tomatoes, down 35%. Jalapeno volume nearly doubled, up 95%. Rates still firmed on seven of nine Imperial lanes, with Chicago up 13%. The Imperial, Coachella, and Arizona production districts again recorded no volume, which suggests the winter desert vegetable deal has not yet started.
On the coast, Salinas-Watsonville volume fell 8% week over week as romaine dropped 23%, while Santa Maria rose 3% and ran 81% above last year on gains in iceberg, romaine, broccoli, and cauliflower. Rates rose on every lane in both districts, led by Salinas into Philadelphia and Santa Maria into Seattle. Kern and Oxnard rates rose 2% to 5% on every lane and run 38% to 57% above last year, with Kern into New York the standout. In the South and Central districts, volume fell 20% week over week as late-summer melons declined. Citrus rates held flat at 35% to 67% above last year, though California districts recorded no citrus volume.
South Texas crossings
South Texas crossing volume fell 11% week over week but stayed 2% above last year. Pharr, the largest crossing, fell 9%, and Laredo dropped 20%. Avocados, the biggest line, fell 20% week over week and rose 9% year over year, while broccoli bucked the trend, up 8%. Rates split by destination: Atlanta led at +14% and Miami rose 7%, while five lanes into the Northeast, Chicago, and Los Angeles eased 1% to 4%.
Washington apples and pears
Washington volume rose 3% week over week and fell 12% year over year. The Yakima and Wenatchee district slipped 1% and ran 26% below last year, with apples down 4% and pears up 27%. Columbia Basin volume rose 10%, with dry onions up 9% and potatoes up 15%. Rates held flat on every lane at 50% to 103% above last year, led by the Los Angeles lane.
Watermelon season wraps
USDA issued its last watermelon rate reports of the season for North Carolina and Delmarva. North Carolina volume rose 116% week over week, led by sweet potatoes, up 145%, while watermelons fell 31%. Delmarva volume fell 20% week over week and watermelon volume fell 46%; its 168% year-over-year gain comes from a small base. Rates held flat on every lane in the final reports, and Delmarva finishes 5% to 56% above last year.
What this means for carriers, shippers, and brokers
Carriers: The best money remains in Washington apples and pears, where every lane held flat at an average 72% above last year, topped by the Yakima and Wenatchee lane into Miami. The momentum is in California, with Santa Maria into Miami the highest-paying California lane and Kern into New York up 57% on last year. Destination matters out of the desert crossings: Imperial freight into Chicago rebounded 13% while the Boston lane slipped 2%. Use caution on South Texas into the Northeast and Midwest, where rates into Baltimore, Chicago, New York, and Los Angeles eased 2% to 4%, even as Atlanta jumped 14% and Miami 7%. With California volume down 11% and its rates still climbing, carriers appear to have room to hold firm on California pricing, and steering South Texas trucks toward the Southeast looks like the stronger play.
Shippers: Budget for a market well above last year on every comparable lane: California averages 44% above 2025, South Texas 41%, and Washington 72%. The week brought no relief out of California, where rates rose on every coastal and valley vegetable lane. The softer spots are narrow: South Texas rates into Baltimore fell 4%, Chicago 3%, New York and Los Angeles 2%, and Boston 1%. Waiting has not helped on Washington apples and pears, which have held flat at 50% to 103% above last year while Yakima and Wenatchee apple volume runs 28% below a year ago, or on South and Central citrus, flat at 35% to 67% above. Flexibility on the receiving point is where the savings sit: out of Imperial, Philadelphia runs about 7% below Baltimore and about 10% below New York at the midpoints. With Thanksgiving volume ahead and California rates rising on falling volume, covering California and Washington freight for early November now appears to limit exposure to further increases.
Brokers: The week splits into freight to price up and freight to buy down. California is the price-up side: volume fell 11% week over week and rates rose on every coastal and valley vegetable lane, so quote California business with room and expect carriers to hold out for more. South Texas is the buy-down side for northbound freight, with volume down 11%, Laredo down 20%, and rates into Baltimore, Chicago, New York, Boston, and Los Angeles easing 1% to 4%, which widens margin where a customer’s price is already set. The exception is the Southeast, where South Texas into Atlanta rose 14% to run 75% above last year and Miami rose 7% to run 68% above, so do not price Texas freight to either city off last week’s numbers. Brokers who lock carrier commitments on California freight into the Northeast now, while buying South Texas northbound loads on the day, appear better positioned to protect margin than those who treat the two origins the same.
About these rates
Rates are for Tuesday, October 13, 2026. Week-over-week changes are USDA’s printed changes from Tuesday, October 6, 2026. Year-over-year changes compare the midpoint of each lane’s mostly range with the same origin district and destination city in the USDA report for Tuesday, October 14, 2025. Volumes are USDA AMS AgTransport reported refrigerated truck movement of fresh fruits and vegetables.