The American Trucking Associations’ (ATA) advanced seasonally adjusted (SA) For-Hire Truck Tonnage Index increased 2.7% in June after rising 0.3% in May. Compared with June 2021, the SA index increased 7.9%, the tenth straight year-over-year gain and the largest since June 2018. The not seasonally adjusted index, which represents the change in tonnage actually hauled by fleets before any seasonal adjustment, equaled 124.5 in June, 4.2% above the May level (119.5).
“June’s jump tells me a couple of things: First, the transition in the freight market from spot back to contract continues. ATA’s tonnage index is dominated by contract freight, so while the spot market has slowed as freight softens, contract carriers are backfilling those losses with loads from shippers reducing spot market exposure,” said ATA Chief Economist Bob Costello. “Essentially, the market is transitioning back to pre-pandemic shares of contract versus spot market. Second, and perhaps equally important, while economic growth is expected to be soft overall in the second quarter, the goods economy wasn’t as bad as feared,” he said.
In contrast, Cass Freight Index declined 2.6% m/m in June and 2.3% on a y/y basis, similar to the 2.7% y/y decline in May. Normal seasonality from this index level would imply shipments down 1% y/y in Q3 and down 5% y/y in Q4 for 2022. The expenditures component of the Cass Freight Index, which measures the total amount spent on freight, rose 8.8% m/m in June to a new record, with shipments down 2.6% and rates up 11.7%. It is estimated that roughly ten percentage points of the y/y increase are due to fuel prices alone.
All rates cited below exclude fuel surcharges unless otherwise noted.
In a repeat of last summer’s events in Los Angeles, BNSF Railway and Union Pacific Railroad are metering how many ocean containers they haul from Los Angeles and Long Beach ports. According to the JOC, “shippers’ inability to retrieve containers from inland ramps and returning chassis fast enough to create room for additional cargo” is the primary cause for decreasing intermodal capacity. As was the case last year, truckload capacity tightened as soon as shippers switched to the truckload sector to move volumes on crucial lanes.
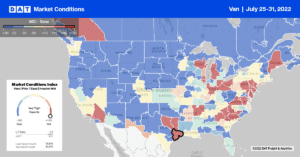
On the high-volume Los Angeles to Chicago, where around 30% of intermodal moves occur, dry van spot rates increased again last week to an average of $1.84/mile, which is up $0.17/mile in the previous month. For context, that’s still $0.87/mile lower than last year. On the Los Angeles to Dallas truckload lane, spot rates are $0.07/mile higher this month at $2.00/mile but still $1.31/mile lower than this time last year.
In the Southeast, spot rates in Atlanta continue to drop following last week’s $0.03/mile decrease to an average outbound rate of $2.01/mile. Further north in Elizabeth, capacity continues to tighten, with spot rates up for the fourth week to $1.78/mile following last week’s $0.02/mile increase. Loads from Elizabeth to Chicago have increased by $0.05/mile to an average of $1.48/mile in the last month, while loads to Atlanta were also up by $0.03/mile to $1.57/mile.
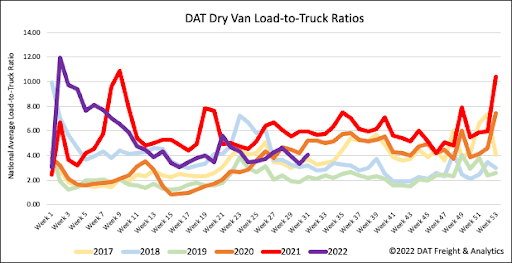
End-of-month shipping volumes increased dry van load post volumes by 13%, resulting in capacity tightening slightly. With load post volumes above one million loads, we’re still seeing a very healthy spot market, which is just 6% lower than this time in 2020 but down 29% y/y. As a result of higher load posts and 8% fewer equipment posts last week, the dry van LTR increased by 22% w/w to 4.05.
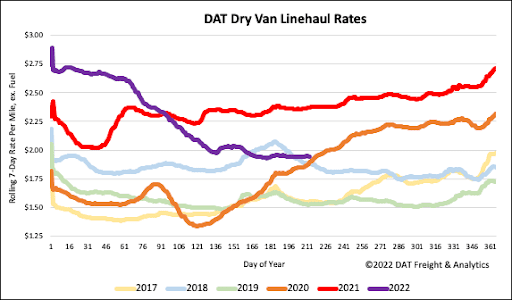
As we predicted last week, falling diesel prices have increased dry van spot rates by just under a penny-per-mile last week. The national average linehaul rate now stands at just over $1.96/mile. Compared to the top 50 lanes for dry van freight, spot rates are still $0.40/mile higher than the previous week but $0.06/mile lower than in 2018, according to data collected by DAT. Dry van linehaul rates are also $0.43/mile lower than the previous year but $0.06/mile lower than in 2018. Dry van linehaul rates excluding fuel have dropped by over 29% or $0.81/mile YTD but are still $0.35/mile higher than the average of pre-pandemic years.


