Trucks were readily available on the spot market in 2015, and at bargain prices — at least when you compare to average rates in 2014. If you take a longer view, however, it’s 2014 that looks like the exception. Spot market rates were higher in 2015 than in 2013, the most recent “normal” year.

Load volume in 2015 was roughly on par with 2013, due entirely to heavier demand in the first half of the year. Load posts tailed off in Q3 and Q4, signaling a shift that will likely play out in 2016. The American Trucking Associations Tonnage Index (right) showed the same pattern of large increases in the first half of the year, followed by tepid growth in the second half, and Q4 appears particularly weak. Does this mean we are headed toward recession?
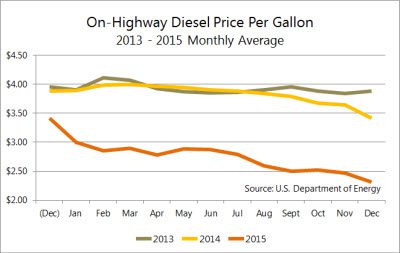
Fuel prices played a big role in 2015, both because fuel is such a big factor in truck operating costs and because the fuel surcharge has been a component of carrier revenue since the early ’90s.
The truckload rate graphs below depict line haul rates with the fuel surcharge omitted, but the impact of low fuel prices has been profound. Fracking activities were curtailed, and the drilling equipment and materials of 2014 disappeared, freeing up rail, intermodal and flatbed capacity, and removing an alternative source of employment opportunity for would-be truck drivers. Low fuel prices enabled large carriers to improve driver pay and benefits, and small carriers were able to survive on lower rates, even if they didn’t enjoy the experience.
Retail results indicate modest economic growth. Analysts predicted that consumers would boost the economy by spending the money they had saved at the pump. Early reports from the National Retail Federation indicate modest year-over-year growth, and the NRF predicts continued improvement in 2016, based on upward trends in new housing starts, auto sales, and employment, as well as retail.
Government spending and regulations exert a push-me-pull-you effect on trucking. The highway funding bill should provide a boost to infrastructure projects, and there is not likely to be much additional action from Congress in 2016, an election year. However, new regulations have already been announced — including emissions reduction, e-logs, and adjustments in reporting of carrier safety scores — and others are pending. Some of these new rules will affect capacity in 2016, for good or for ill.
Truckload pricing trends point to greater stability in 2016

Shown side by side, here are three-year trends in rates and load-to-truck ratios, for the three main equipment types. (Scroll down to view each graph at full size, with individual captions.)
In 2015, a steady upward climb in contract rates was the most important trend for large fleets. Contract rates are negotiated directly between shippers and carriers, and large fleets have more opportunities to cultivate those relationships. The graphs below show that 2014’s big increase in spot market rates prompted large fleets to increase capacity at the end of the year, as demonstrated by a spike in Class 8 truck purchases at the end of last year. Large carriers also improved driver compensation and reduced turnover, which further improved capacity. To pay for the expansion, carriers raised contract rates throughout 2015. As noted earlier, the line haul rates increased but fuel surcharges declined, so the increase in net revenue per mile was not as dramatic.
Each spike in spot market rates was related to a surge in the load-to-truck ratio on the spot market. Typically, the ratio — a simple calculation, dividing the number of load posts by truck posts on DAT load boards — indicates pressure in the marketplace. A change in the ratio precedes a change in spot market rates. Lane rates react dynamically to changes in demand and capacity, trending up and down within days, if not hours.
A sustained increase in spot market rates typically leads to an increase in contract rates. Because contract rates are negotiated on a longer-term basis, it can take months to see a change. Also, seasonality has a huge impact on spot market rates, but contract rates take seasonality into account, and the longer-term pricing tends to smooth the seasonal peaks and valleys into a six- or twelve-month average.
2015 Looks Like 2013, but With More Trucks
In 2014, spot market rates kept going up and up, as the Polar Vortex was followed by labor disputes at West Coast ports, and the market never seemed to catch up. Contract rates didn’t rise right away. By the end of 2014, big carriers realized they needed to boost capacity. They bought more trucks and spent more money to attract and retain drivers. In 2015, those large fleets were well positioned to handle a larger portion of the freight.
As contract carriers expanded capacity, fewer loads flowed to the spot market and its freight brokers and 3PLs. The result: 2015 looked a lot more like 2013 on the spot market, but with more trucks.
In 2016, Spot Market Players Will Close the Gap
These graphs also hint at trends that are likely to emerge in 2016. As contract rates rose and spot market rates declined, the gap widened throughout the year. That gap represents opportunity for 3PLs and freight brokers, who can offer truckload services at a competitive rate in 2016, to reclaim some of the market share they lost to large carriers last year.
Assuming that total freight volume is stable or increases modestly, there should be an uptick in spot market van load availability and rates, supporting renewed growth for intermediaries, small to mid-sized for-hire fleets, and owner-operators. As Q1 is historically a slow period on the spot market, we can expect the recovery to begin in late spring, barring big, unexpected events that affect transportation.
Here is the breakdown by equipment type, starting with dry van. Graphs are enlarged for clarity.

DRY VAN – In 2015, the gap widened between contract rates and spot market rates. There was a 9¢ difference between contract and spot line haul rates in January, but by December, the difference was 22¢ per mile. Contract rates added 5¢ over the year, but spot market rates dropped 17¢.

REEFER – Refrigerated truckload rates looked similar to van rate trends from 2013 through 2015, but with more seasonal variability. Additional factors combined to suppress peak season volume, including drought conditions in California and Texas, and citrus greening in Florida. Imports increased, and infrastructure improvements in Mexico led to a shift in geographic focus, to favor border crossings in Texas and Arizona more so than California. Strict emissions controls in California add to pricing pressure on reefer carriers in the Golden State, but drought-related issues reduced freight volume and mitigated the impact of those regulations. Bottom line: contract carriers were able to handle a larger proportion of reefer freight in 2015, and spot market rates drifted down. As with vans, the gap widened considerably in 2015 between contract reefer rates and spot market rates.

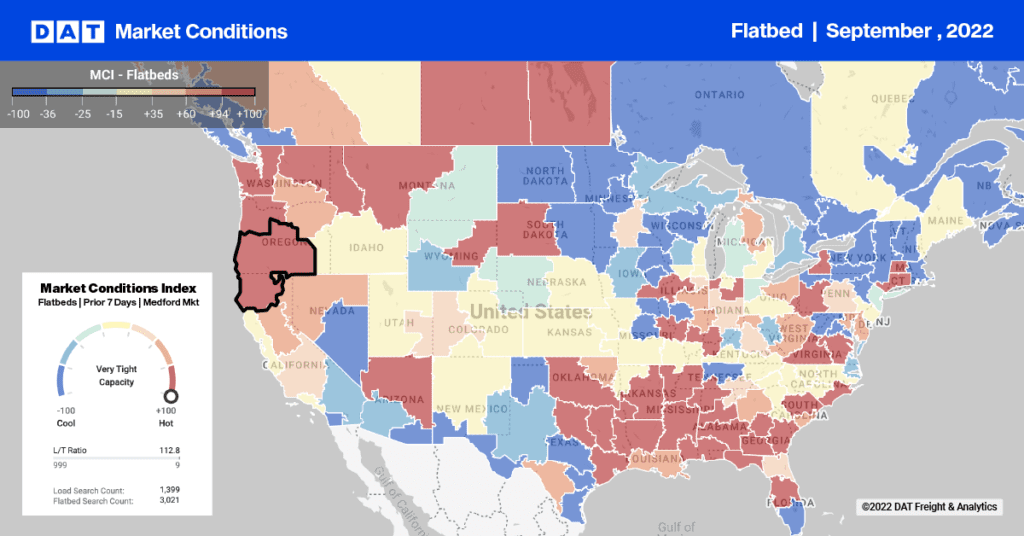
FLATBED – Economic sectors that declined last year were the ones that historically offer flatbed freight, including oil and gas, steel, and construction. Auto manufacturing was a bright spot, at least for the first half of the year. These macroeconomic trends led to geographic shifts, as Alabama rose in prominence and Texas declined in importance as sources of flatbed freight. Load-to-truck ratios plummeted, and spot market rates softened, to end the year at a national average of $1.72 per mile, or $1.93 including the fuel surcharge.
Demand and capacity information is based on load and truck posts from DAT Load Boards. Rates are derived from DAT RateView and are based on actual rate agreements between freight brokers and carriers. Reference rates in this article do not include fuel surcharges, accessorials, or other fees.