Although freight loads have been readily available on DAT Load Boards this month, truckload rates are drifting down. That’s because truckload capacity is becoming looser, as demonstrated by a steady increase in truck posts on DAT Load Boards.
I know some people who read this blog are skeptical, and there are valid reasons to wonder about the data. Brokers post loads more than once, carriers post trucks more than once or not at all. All true. Even so, those behaviors increase when there is pressure in the marketplace. All trends are local, in freight transportation as in real estate. Also true, and you really do need to look at individual markets and lanes before you make operational decisions based on a broad trend.
Load Board Trends Provide an Advance Indicator
However, with millions of transactions per week, DAT Load Boards provide a strong indicator of truckload spot market demand and capacity, both nationwide and for individual lanes. We have been collecting this information from our load boards since 1981, and we have reported it since the mid-1990s. More recently, we are able to show that these load board trends are an advance indicator of changes in freight rates.
DAT also has more than six years of data on truckload rates in DAT RateView, and 100% of those rates are from freight bills and rate agreements, recording actual payments to carriers. DAT is also the only company to maintain a separate rates database for broker- and 3PL-paid spot market rates. The spot market rates react immediately — sometimes within less than a day — to the volume of freight loads and trucks in a market or lane. When capacity gets tight, rates go up within a week or less. This happens about 80% of the time.
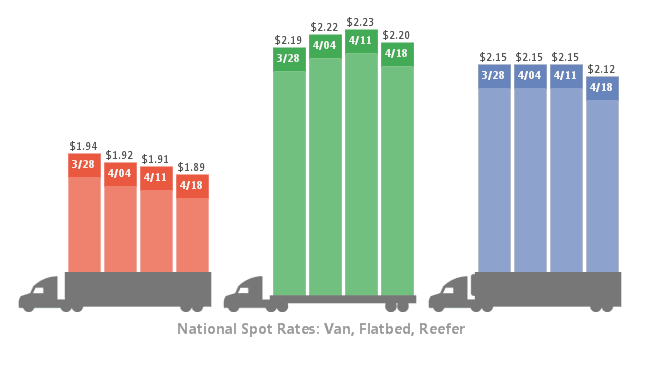
Since the end of March, there have been slightly fewer load posts and slightly more truck posts each week than there were the week before. Rates started to drift down, first for vans, then for reefers, and flatbeds. The declining cost of fuel played a role, because the fuel surcharge continues drive the total rate lower, but even the line haul portion of the rate is starting to drop now.
Seasonal Demand Boosts Rates in May and June
What happens next? Rates typically rise in May and peak in June, especially for reefers, due to high demand generated by fruit and vegetable harvests in the Southeast, Texas, Southwest and parts of California. Fresh produce can’t wait for a train, and it can’t sit in a warehouse too long, so both the volume and the urgency drive up freight load quantity and prices.
Less obviously, the surge in demand for reefers also puts a squeeze on van capacity. Carriers who have both dry and refrigerated van trailers will prefer to haul reefer freight in produce season, so available power units and drivers will park dry box trailers in the yard until demand is more slack.
We expect seasonal volume to kick in within a week or two, which should boost rates. Vans will likely get closer to $2.00 a mile, for at least a few weeks. What does not seem likely is a repeat of the record highs of 2014, when the national average rate exceeded $2.00 from the first week in June through year end.
To learn more about DAT Load Boards, or to request a demo, please contact our award-winning customer service team 800.551.8847 or complete this online form.