Almost all consumer fireworks and a significant majority of professional display fireworks used in the United States are imported from China. In fact, approximately 96-97% of total U.S. fireworks imports, totaling nearly $400 million annually, come from China. This dominance is driven by China’s long-standing expertise in pyrotechnics and its lower labor costs.
Get the clearest, most accurate view of the truckload marketplace with data from DAT iQ.
Tune into DAT iQ Live, live on YouTube or LinkedIn, 10am ET every Tuesday.
Although the U.S. boasts a robust industry for firework displays, exemplified by New Castle, Pennsylvania—known as the “Fireworks Capital of America”—the manufacturing of fireworks, especially consumer-grade items, is predominantly done in China. Domestic production faces hurdles such as high labor costs, stringent regulations, and a scarcity of raw materials.
New Castle, Pennsylvania, holds historical significance in fireworks manufacturing, hosting the headquarters of Zambelli Fireworks Internationale and Pyrotecnico. Founded by Italian immigrants in the late 19th and early 20th centuries, these companies have created renowned pyrotechnic displays for major national events like presidential celebrations, Super Bowls, and Fourth of July festivities.
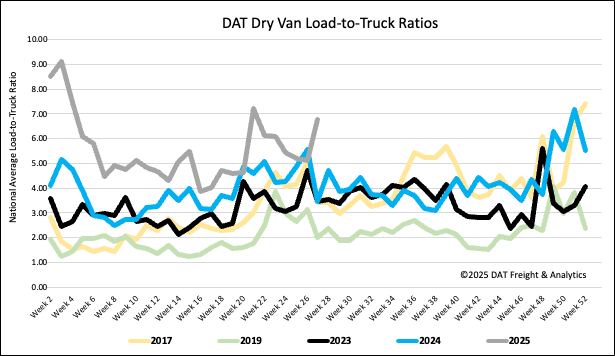
Load-to-Truck Ratio
Last week, dry van load posts surged by 16%, mirroring the typical Week 26 trend observed over the past decade as shippers position holiday freight for July Fourth celebrations. Concurrently, carrier equipment posts decreased by 13% week-over-week. These combined factors led to a slight increase in the dry van load-to-truck ratio, reaching 6.78.
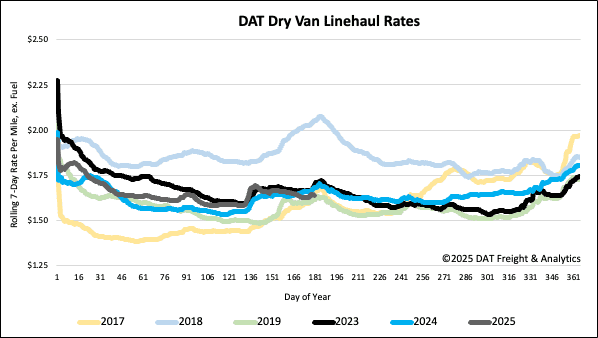
Linehaul spot rates
Last week, the average dry van linehaul spot rate dropped by $0.02 to just over $1.65 per mile. This is $0.04 lower than the same time last year and only $0.02 higher than during the 2019 freight recession.
For DAT’s top 50 lanes by load volume, the average rate was $1.98 per mile, a $0.01 per mile decrease from the prior week. However, this average remains $0.33 higher than the national 7-day rolling average spot rate.
In the 13 key Midwest states, which account for 45% of national load volume and often foreshadow national trends, spot rates saw a $0.01 per mile reduction. Outbound load volume in the region fell by 4%. Carriers in these states earned an average of $1.84 per mile, exceeding the national 7-day rolling average by $0.19.