Our usual theme for Spring is to look South for an increase in freight activity. This year has been different in many ways, and one of those atypical trends is playing out right now: Northern geographies are in the forefront, with the first surge of spring freight on the spot market.
Because many companies are closing the fiscal quarter this week, just ahead of the actual end of the month on Monday, I am taking a close look at week-over-week growth in freight volume in DAT RateView, comparing the week of March 21-27 to the prior week, March 14-20.
What surprised me was that Zone 4, including Kentucky, Indiana, Michigan, and Ohio, displayed the biggest growth in freight, an 8.1% increase. The next-highest growth was in Zone 6 consisting of Illinois, Missouri, Kansas, and Nebraska, with a regional increase of 7.5% compared to the previous week.
Tied for third place, two clusters of states exhibited a 7.0% increase: Zone 2, encompassing Maryland, Virginia, West Virginia, North Carolina, South Carolina and the same 7.0% gain for Zone 7, including Arkansas, Louisiana, Oklahoma and Texas.
We can probably look to winter weather and pent-up demand as contributors to the strong results in those Northern states. The upward trend in the South Central region, however, is not directly related to weather, but more likely evidence of the increased influence of the energy sector on the U.S. economy. Energy-related freight trends continue to originate in the South Central region, not only because of drilling in that area, but also because heavy equipment moves from Texas and surrounding states in the spring to shale oil and gas drilling sites elsewhere in the country. Production in those areas was suspended during the winter months, re-starting in spring.
Further to the south, a 6.0% increase graced the states in Zone 3: Alabama, Florida, Georgia, Mississippi, and Tennessee. That gain matches the national average, at a time of year when the Southeast is usually leading the country as a harbinger of spring. This year, those seasonal trends are still emerging but they are overshadowed by strong volumes in the Midwest and Southwest.
Meanwhile, out West, the Rocky Mountain and Southwestern states of Arizona, Colorado, Idaho, New Mexico, Nevada, Utah and Wyoming (Zone 8) came in last with just 1.6% growth. Second from last at 4.0% growth were the Pacific Coast states in Zone 9: California, Oregon, and Washington.
Note, however, that load counts increased in every Zip Code zone last week, and the nationwide total surged 6.0%, so the differences among regions are only a matter of degree.
Below is a summary of the week-over-week changes, comparing the week of March 21-27 to the week of March 14-20, in table form. These are advance indicators of seasonal freight volume, and likely harbingers of spring rate trends, as well, ranked by the week-over-week increase in load volume:

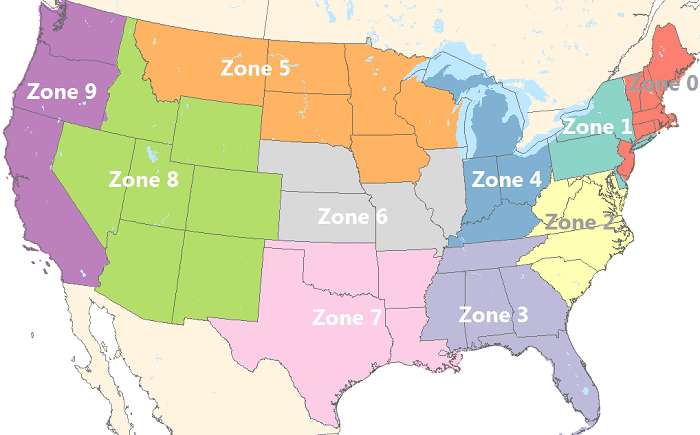
Here is a zip code zone map, for further reference: