At a meeting yesterday, my colleagues were asking where rates are headed in early April. This isn’t an easy thing to know, as often the first week of a new quarter has a kind of hangover effect, where freight volumes are down. We also see the same impact after a major holiday, when freight isn’t always in such a big hurry to get on shelves.
But the one thing we do know is that 2018 continues to shape up as anything but ordinary. Load-to-truck ratios and rates are at record levels, but the ongoing question is “how much longer?” Here we are, only two days into the new month, and DAT RateView is providing an answer.
The penalty phase of the ELD mandate took full effect on April 1st. It’s too soon to get much feedback on enforcement, as a lot of drivers took Sunday off, and those fully rested drivers were just hitting the highway on Monday. Meanwhile DAT has already collected thousands of rates through its nightly collection process. And guess what – once more, rates took a jolt upward.
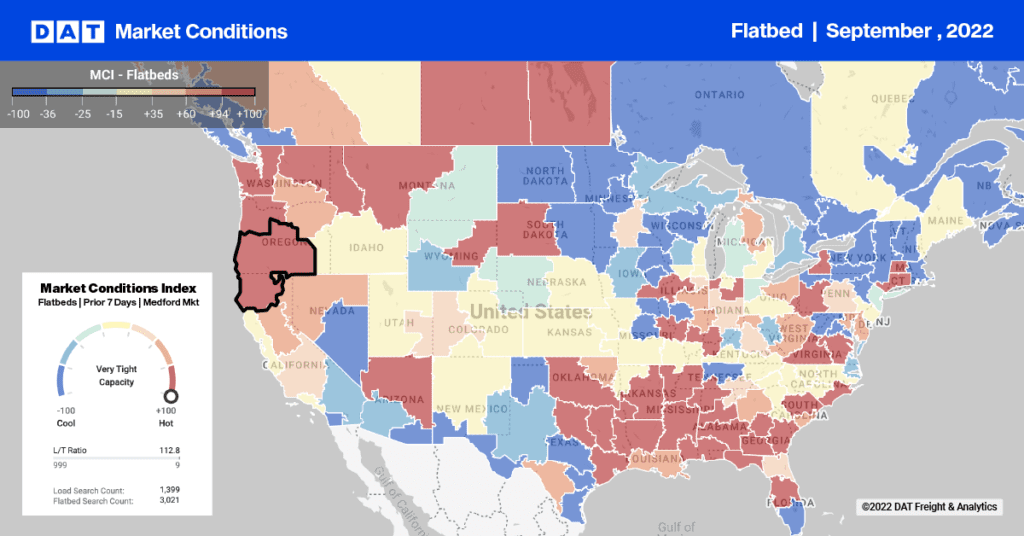
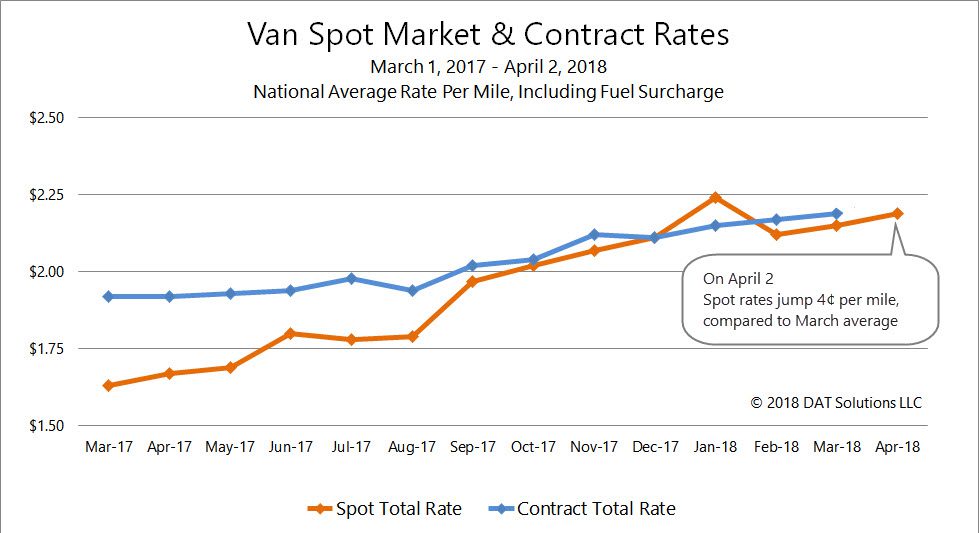
As soon as I got to the office this morning, I checked the national charts. Van rates were up 4¢ from the March average, raising the national average rate from $2.15 to $2.19/mile. Flatbed rates moved up 3¢, from $2.53 to $2.56/mile. And refrigerated rates jumped the most, up to $2.45/mile, a 5¢ increase. Contract rates were up, as well — but they may settle down again. We’ll know more next week.
Now, one day isn’t a trend, it’s just a data point. But this particular data point tells us that the ELD mandate, plus a strong economy, beat the typical post-quarter close and post-holiday slump.
You can look up one-day rates for yourself, any time, in the state-to-state and region-to-region matrices in DAT RateView. Those one-day rates can be compared with 7-day rates, 30-day rates, or some other time period, to give you more insight into trends.
For example, I can see that California intrastate reefer rates were at $2.43/mile on Monday, and compare that to a 7-day California intrastate average of $2.33/mile. The 10¢ increase suggests that produce season has started to put pressure on rates. Within Texas, van rates moved up from $2.20 last week to $2.24/mile on Monday. You can download two different periods and look at rate movements between states or regions, as well.
We’ll keep tracking the trends and reporting here in the DAT blog. Meanwhile, I hope to see some friends at the upcoming TIA Conference. Please stop by and see me next week in the DAT booth, #304.