I watch transportation statistics all day, every day. It’s my job, but it also fascinates me. After 30 years in this industry, working for carriers, 3PLs and shippers, I am able to piece together seemingly unrelated pieces of information and understand or even predict an emerging trend. Now and then, however, the data from one source contradicts data from another, equally reliable source, and I am left scratching my head.
Last week’s spot market trends presented just that kind of challenge. Spot market capacity rebounded as expected from the July 4th holiday week, with a 25% week-over-week increase in truck posts. When a full, five-day week follows a four-day week, you expect a 25% increase in all load board activity, but load posts increased only 3.5%.
At the same time, there was a big increase in the volume of loads moved by many of the brokers who contribute data to DAT RateView.
Although both the load board data and the RateView data are associated with DAT products, there is an important difference between these two data sets. Brokers post loads in order to attract the attention of for-hire carriers, including owner-operators and small fleets. The broker wants to move a specific load, represented by a load post, and when trucks are tight, the load post may be refreshed more often to encourage the carriers to respond. Even when they have a reasonable expectation of covering the load with their core carriers, many brokers will post the load as a way to establish relationships with new carriers who can support their business in the future.
The RateView database, by comparison, is based on actual rate agreements. These records describe, in great detail, freight loads that have already moved on a specific lane, at an appointed time, for an agreed-upon rate.
This begs the question: If this representative group of brokers moved more loads last week than they did in the previous week, why didn’t the load board volume reflect a big week-over-week increase?
There are a couple of factors in play here. First, shippers were slow to gear up after the holiday weekend, but trucks were ready to move, so there was looser capacity relative to the amount of freight being offered. Because the post-holiday week also marked the beginning of the typical July lull, a lot of the demand was accommodated by large and mid-sized contract fleets.
When shippers exhausted their list of core carriers, or the carriers ran out of capacity, one or the other would call 3PLs or freight brokers who had their own lists of core carriers. By the end of the week, the freight had been moved, and brokers covered many of those loads without posting them to a load board.
In general, large fleets have been commanding a bigger share of truckload freight in recent months. Big improvements in driver turnover are one contributing factor. While large fleets likely increased their labor costs, they saved money in other ways. The improvement in driver retention means lower costs associated with recruitment, advertising, and training. Driver loyalty also supports big improvements in equipment utilization, so you don’t hear so many complaints from fleet owners this year about unseated trucks.
For freight brokers, this is a “good news, bad news” scenario. Fuel costs are down, and small carriers are hungry for freight. Those conditions usually lead to improved margins for the broker. On the other hand, while seasonal freight volume remains soft, the brokers’ top-line revenue doesn’t grow.
More good news: July will be over soon, and the retail freight season should ramp up shortly after that. Meanwhile, brokers can use this time to emphasize business development, with new, value-added services, a new region or equipment type, or a customer and cargo type that has a different seasonal or regional focus from your current network.
Note that the recent trends also have a different seasonal impact on each of the three main equipment types. In RateView, which reflects loads that were moved by brokers, van load moves continued to increase after the holiday. Flatbed and reefer loads waned, however, compared to the previous week. Interestingly, when you look at the national average rates for line haul, excluding the fuel surcharge, van rates remain consistent with June averages, but flatbed and reefer rates were drifting down.
Freight volume should pick up again in a few weeks, as imports start to arrive in advance of the Christmas selling season. Regional shifts are already underway. Stay ahead of the trends with the Hot Market Maps in the DAT Power load board and DAT RateView, where you get a daily view of demand and capacity in your markets, by equipment type, or look at weekly summaries in DAT Trendlines for a broad overview.
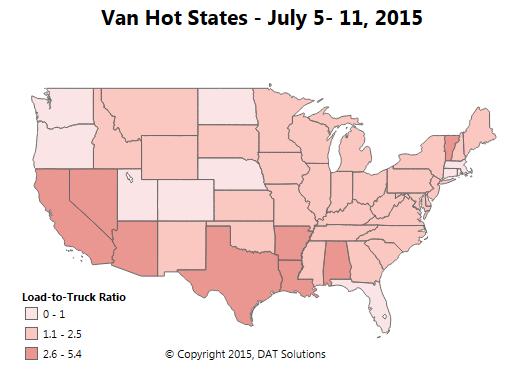
A typical July lull eased capacity pressures after the Independence Day weekend. Load-to-truck ratios declined across the country, and van rates dropped in the Southeastern U.S.


