Van rates continued a seasonal slide last week, but the national average van rate was still 1¢ higher than the June average, even after a decline of 5¢ per mile for the month to-date. To put this in context, the June average was the highest for dry van equipment since at least 2010, and possibly the highest ever. When July ends next week, rates could be within a few cents of that peak.
There are some signs of easing. While truckload capacity has been tight all year, and demand is still intense, we’re starting to see a decline in volume on the high-traffic lanes. On the top 100 van lanes by volume, load counts lost more than 7% last week compared to the week before. Of those 100 lanes, only 18 had higher rates, while 76 went lower week over week, and 6 were neutral.

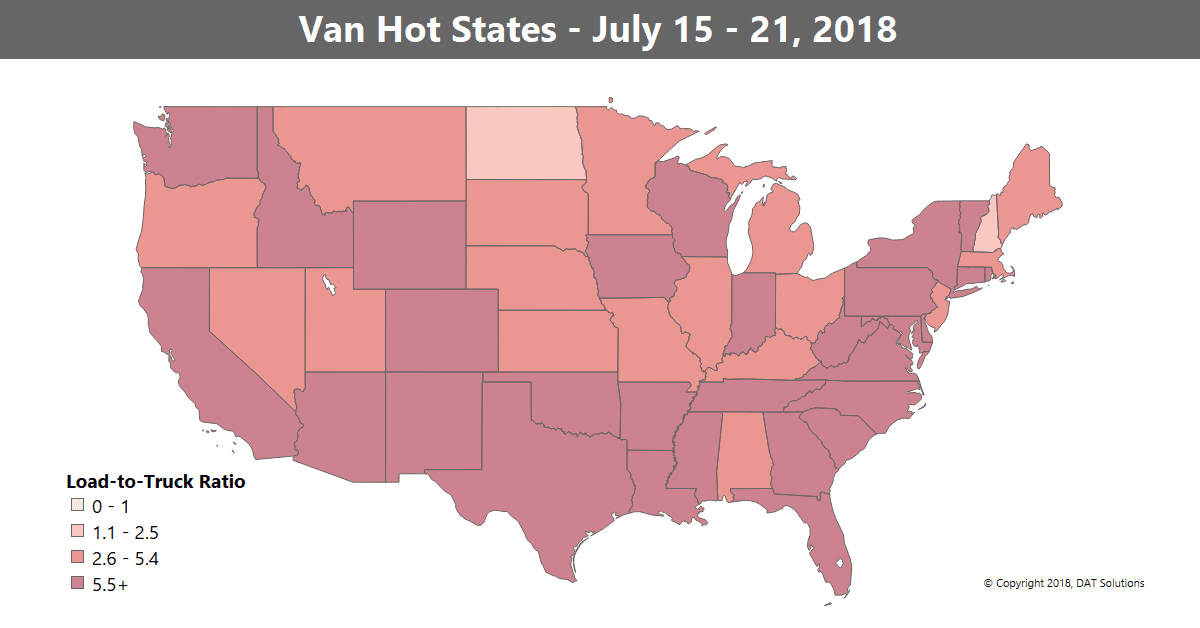
Truck capacity is loosening, but remains tight in the southern band of states. This map depicts outbound load-to-truck ratios for dry vans in the 48 contiguous U.S. states, and darker colors correspond to higher ratios. The load-to-truck ratio represents the number of loads posted for every truck posted on DAT load boards. The ratio is a sensitive, real-time indicator of the balance between demand and capacity, and changes in the ratio typically signal impending changes in freight rates.
Hot Van Markets
Los Angeles and Houston are still moving strong volumes, but the Midwest is slow. Rates were down in almost every major market, but Buffalo dipped the least, slipping by an average of less than 1%.
All rates below include fuel surcharges and are based on real transactions between brokers and carriers.
Rising Lanes
Some of last week’s lanes with rising prices included:
- Rates from Seattle to Stockton, CA, added 17¢ to an average of $1.49/mile, a sign that the Northwest is starting to stabilize after a recent downturn.
- Buffalo to Chicago increased 16¢ to $2.06/mile, and the return trip also saw a jump.
- Chicago to Buffalo gained 10¢ to hit $3.32/mile.
Falling Lanes
The Southeast saw lower rates last week, with prices declining out of Atlanta, Charlotte and Memphis:
- Atlanta to Charlotte plunged 45¢ to $3.15/mile.
- Atlanta to Chicago fell 25¢ to $2.12/mile.
- Memphis to Charlotte dropped 26¢ to $2.65/mile.
- Charlotte to Allentown was down 25¢ to $3.19/mile.
- And Charlotte to Chicago declined 24¢ to $2.19/mile.
Find loads, trucks and lane-by-lane rate information in DAT load boards, including rates from DAT RateView.


