Van load availability edged up 0.5% last week on the spot market, but truck posts added 3.7%, so the load-to-truck ratio declined 3.1%. Volume trended up last week in Los Angeles and Memphis, where load-to-truck ratios of about 2.0 are hovering above the national average.

Check out these “hot markets,” where a shortage of trucks makes it easier to get a load this week:
- Twin Falls, ID
- Spokane, WA
- Portland and Medford, OR
- Salt Lake City, UT
- Green Bay, WI
- Little Rock, AR
Some of the freight is seasonal, including shelf-stable grocery items and Christmas trees. Check load availability at your destination before you start out. High load-to-truck ratios turned the map dark red in the Dakotas and Mississippi last week, but those states don’t offer enough loads to justify any deadhead. If you’re in those areas anyway, you could get lucky.

Vans lost 2¢ last week, to $1.70 per mile, after a 1¢ bump in the previous week. High-paying lanes — the ones with rates above $2.00 per mile — took the biggest hit. But a handful of lower-priced lanes saw increases that brought them closer to the $2.00 mark. If you’re in the neighborhood, look for loads here: Columbus to Memphis and Memphis to Indianapolis. (High-paying loads are also available from Indianapolis to Columbus, so this could be a TriHaul option.)
 Rates trended down in both directions between Buffalo and Philadelphia last week, and the 385-mile length of haul makes it hard to get the best use of your driving hours and equipment in those two days.
If you just drive back and forth, you make between $1,700 and $1,800 for the two days, but a good TriHaul can add loaded miles at a higher rate.
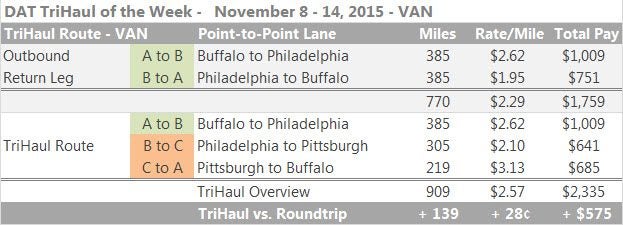
If you can make the full triangle in two days, you end up with $1,150 or more per day, instead of $900, to take home more than $2,300 for the roundtrip. When you unload in Philly, look for a second load to Pittsburgh, and then find a load from Pittsburgh back to Buffalo. This TriHaul route adds 139 miles of driving, plus extra time at the dock, in exchange for a $575 bump in revenue.
Rates are derived from DAT RateView and are based on actual rate agreements between freight brokers and carriers on 65,000 lanes across the U.S. and Canada. Reference rates include fuel surcharges but not accessorial or other fees. Daily maps, along with detailed information on demand, capacity and rates for individual markets and lanes, can be found in DAT Power Load Boards. TriHaul route suggestions are offered in DAT Express and DAT Power load boards, as well as DAT RateView. A weekly summary of trends can be found on DAT Trendlines.


