The Journal of Commerce Truckload Capacity Index edged up from 72.4% in Q3 2025 to 73.5% in Q4, but don’t read that as a capacity surge. The index remains near its lowest point in over a decade, and carriers are being deliberate about where new trucks go. Rather than chasing spot freight, major fleets are steering capacity toward dedicated, specialized, and cross-border Mexico lanes — Werner being the clearest example, cutting one-way truck counts by nearly 14% year-over-year while acquiring FirstFleet to grow its dedicated footprint by 50%.
Get the clearest, most accurate view of the truckload marketplace with data from DAT iQ.
Tune into DAT iQ Live, live on YouTube or LinkedIn, 10am ET every Tuesday.
The broader story is one of disciplined restructuring in anticipation of a market turn. Publicly-owned carriers are beginning to report low single-digit contract rate increases, and shipper anxiety around capacity availability and cargo security is mounting. Regulatory headwinds — including FMCSA’s crackdown on non-domiciled CDLs and substandard CDL schools — are expected to accelerate small carrier attrition and tighten the supply side further. Even carriers like Covenant, which plan to run a modestly smaller fleet in 2026, are eyeing niche acquisitions and reporting a sharp uptick in shipper bid activity. The setup is increasingly favorable for carriers willing to stay patient.
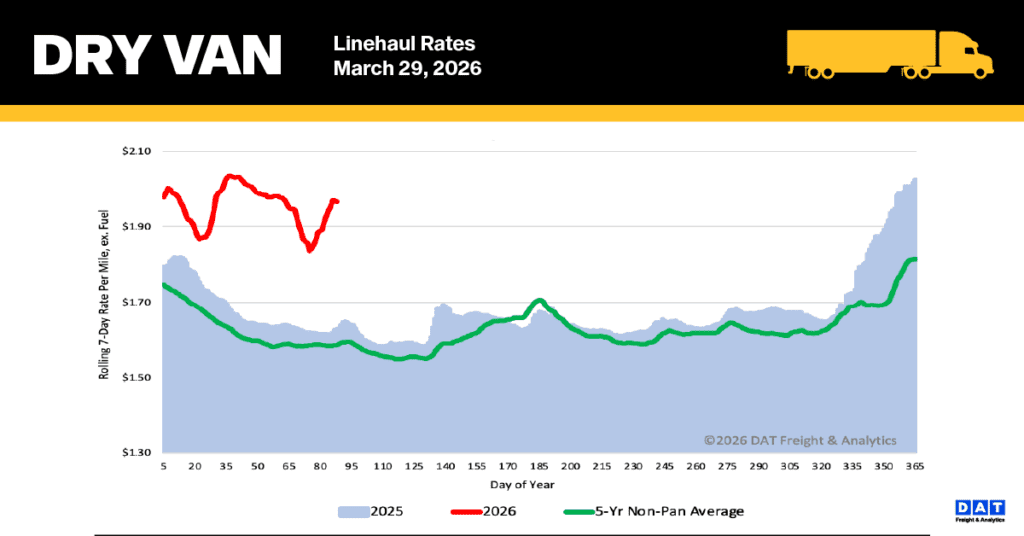
National dry van linehaul spot rates
The national 7-day average linehaul spot rate (excluding fuel) for dry van trucks saw a significant increase last week. This surge occurred despite the almost $1.28 per gallon jump in over-the-road diesel to $5.58/gal since the Middle East War started four weeks ago. Carriers are now recovering a greater percentage of the fuel surcharge, which is currently $0.69/mile.
The current rate of $1.97 per mile remains elevated. This figure is significantly higher than previous years, sitting $0.34 (21%) above the rate recorded a year ago. Furthermore, when excluding the years affected by the pandemic, the rate is still $0.36 (19%) higher than the five-year average.
Spot rates saw a spike in linehaul rates, up $0.10 penny per mile last week on DAT’s top 50 lanes by load volume, reaching an average of $2.29 per mile. This average is $0.32 higher than the national 7-day rolling average spot rate.
In contrast, the 13 key Midwest states, which account for nearly half of the national load volume and are often seen as a bellwether for national trends, experienced a $0.10 per mile surge in spot rates, settling at $2.36 per mile. The Midwest average remains $0.39 above the national 7-day rolling average.
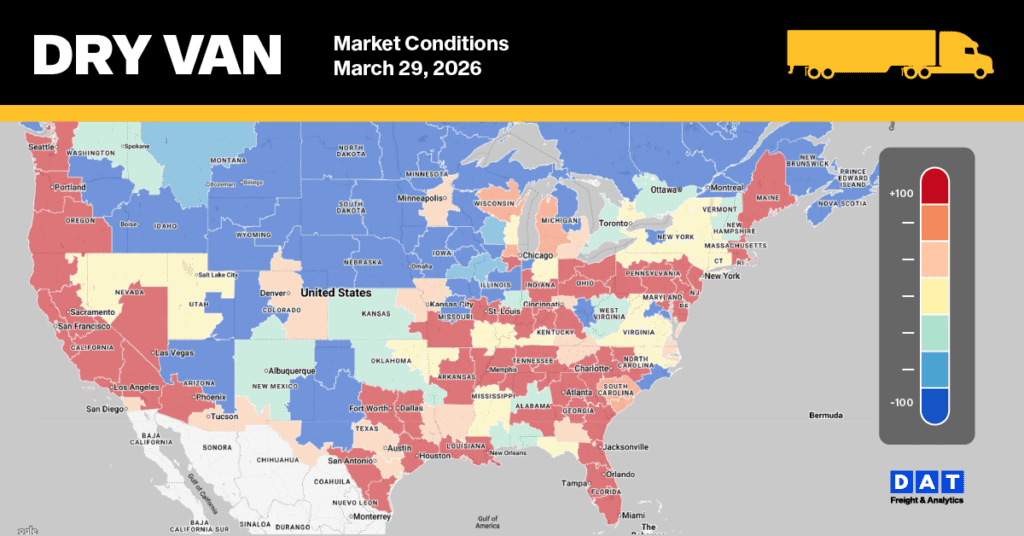
Dry Van Market Conditions
The national dry van load-to-truck ratio was largely unchanged last week, holding steady at 10.6 loads per truck. Load post volume remained flat week-over-week, despite being nearly double the volume recorded during the same period last year and significantly higher than the 10-year average (excluding the 2021 and 2022 pandemic years).