The flatbed market’s demand is closely tied to the health of the construction sector, particularly the sand and gravel market, as construction aggregates are a key indicator. Since official residential construction data from the US Census Bureau is delayed until the end of April due to last year’s Federal Government shutdown, we must rely on other signals.
Key indicators of construction demand:
- USGS construction aggregates production: Production of construction sand and gravel reached 866 million metric tons in 2025. This 2% decline from 883 Mt in 2024 is much shallower than the 8% contraction seen the year before, suggesting a stabilization in the market.
- Big-box retail sales: Retail-level stabilization is reflected in the comparable sales growth posted by Home Depot and Lowe’s for fiscal 2025. This growth, though just above zero, snapped a two-year streak of negative comps.
Census housing starts: January 2026 saw a robust 7.2% month-over-month increase in housing starts, reaching a seasonally adjusted annual rate of 1.487 million. This is the highest level observed since February 2025 and represents a 9.5% jump compared to January 2025.
Get the clearest, most accurate view of the truckload marketplace with data from DAT iQ.
Tune into DAT iQ Live, live on YouTube or LinkedIn, 10am ET every Tuesday.
Market implication for flatbed carriers
These data points collectively suggest that the construction demand trough, which began in 2023, is likely bottoming out.
This outlook implies cautious optimism for flatbed shippers, carriers and brokers. While aggregates—particularly masonry sand used in residential finishing work like bricklaying and stucco—are a lagging indicator (moving after foundations and framing), the early stabilization signals visible in housing starts and retail spending today are expected to translate into increased incremental flatbed load volume later in 2026. This growth is anticipated primarily on short-to-mid haul lanes that service residential construction corridors, especially in the South and Southeast.
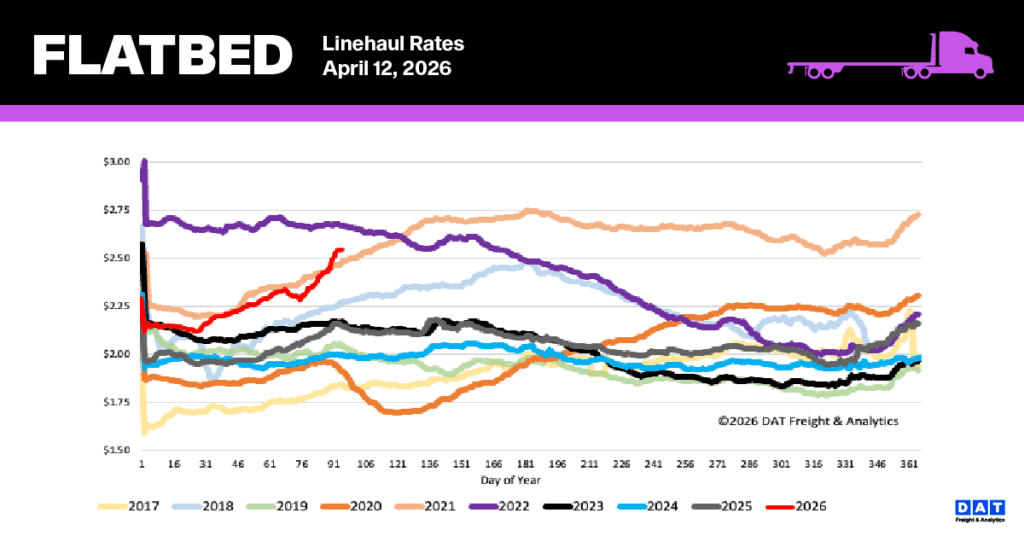
National flatbed linehaul spot rates
Flatbed spot rates continued their upward trend last week, rising by $0.03 to reach a national average of $2.58 per mile. This marks a continuation of the strong momentum seen in the previous four weeks, which collectively added $0.27 per mile to the rate, following the largest single-week increase in over a decade. The current rate is notably higher: it surpasses the rate from the same period last year by $0.45 (a 21% increase) and is $0.54 (23%) higher than the five-year average (excluding pandemic years).
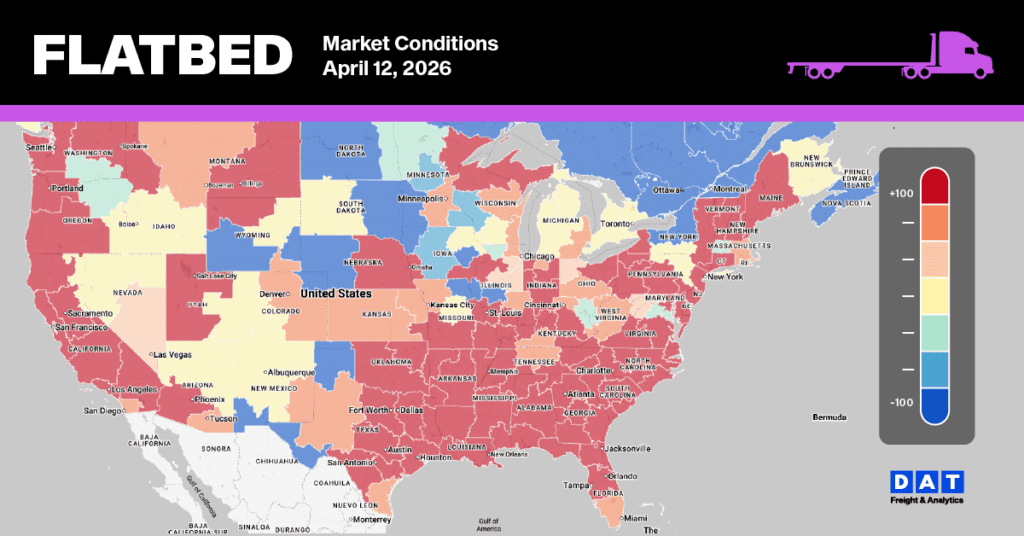
Flatbed Market Conditions
Flatbed load posts rebounded last week, increasing by 9% after an early dip. While this is still 1% shy of the year-to-date high recorded two weeks ago, demand remains exceptionally strong. Flatbed load posts are significantly above historical norms, up 60% year-over-year and 63% higher than the 5-year average (excluding the atypical years of 2021 and 2022). Contributing to the tight market, flatbed equipment posts declined by 6% last week, pushing the flatbed load-to-truck ratio up by 16% to 83.11.