Freight volumes were essentially unchanged in the first quarter, but what shippers paid to move their goods tells a very different story. The U.S. Bank Freight Payment Index, powered by DAT data, shows the National Spend Index jumped 12.9% from Q4 2025 and 21.8% year over year — the largest sequential increase since the pandemic boom of late 2020. Volumes, by contrast, edged down just 0.3% quarter over quarter and were up only 0.6% from a year ago. The disconnect is the whole story: capacity tightened sharply, and shippers felt it in their freight bills before demand gave them any reason to.
Get the clearest, most accurate view of the truckload marketplace with data from DAT iQ.
Tune into DAT iQ Live, live on YouTube or LinkedIn, 10am ET every Tuesday.
Two forces drove spending higher. The first was a supply-side squeeze that’s been building for months as carriers exit the market, park trucks, or consolidate under tighter margins. The second was diesel. National average diesel prices climbed from $3.47 per gallon at the start of Q1 to $5.40 by quarter-end — a 55% increase driven by Middle East conflict, including the largest single-week jump ever recorded ($0.96/gallon in the week of March 2–9). DAT estimated average fuel costs at $0.51 per mile in Q1, up 14.2% from Q4. Meanwhile, DAT spot rates averaged $2.56 per mile in Q1 — up 11.9% quarter over quarter, the steepest climb since the pandemic, and now $0.40/mile higher than the Q2 2025 bottom. Contract rates also rose, narrowing the contract-spot spread as shippers who shifted freight to the spot market during the recession started leaning back on contract carriers.
Regionally, the Midwest was the standout, posting the strongest gains in both shipments and spending — the first year-over-year shipment increase in six years. Auto production, defense manufacturing, and heavy-duty truck orders all provided tailwinds. The Southwest continued its slide, recording its tenth straight quarter of double-digit annual shipment declines, though the rate of contraction is slowing. Spending rose in every single region, regardless of volume direction, which says everything you need to know about where the capacity cycle stands right now. The market isn’t recovering because demand broke out. It’s recovering because supply finally gave way.
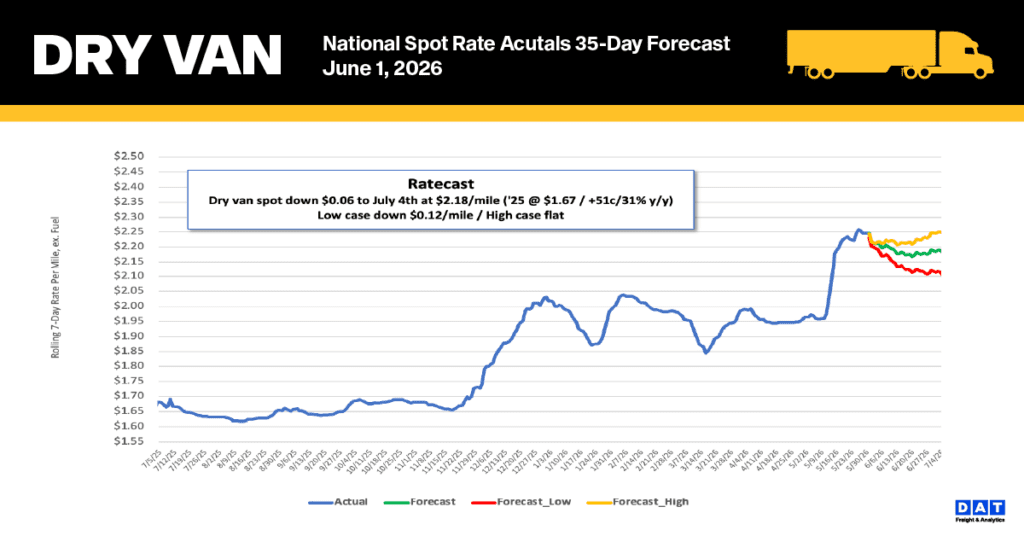
National dry van spot rate trends
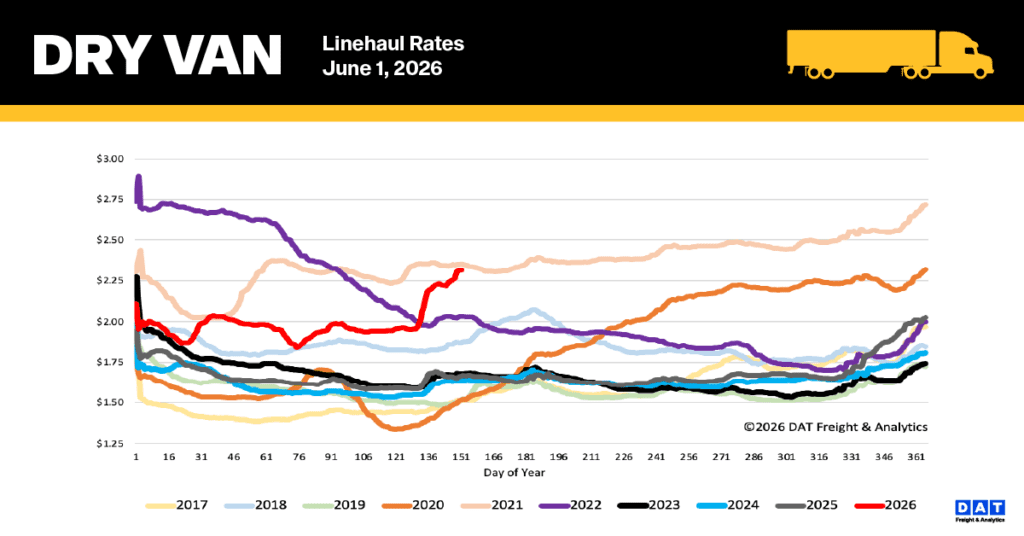
National dry van spot rates continued to climb during last week’s shortened workweek as the market slowly regained capacity following the contraction seen during Roadcheck Week. Linehaul rates, which exclude fuel surcharges, rose by an additional $0.05 per mile, pushing the 7-day national average to $2.32 per mile—a level that significantly surpasses historical benchmarks.
This current rate is 39% ($0.65) higher than the same timeframe last year and 31% ($0.72) above the five-year average for non-pandemic years. When compared to the period immediately preceding Roadcheck Week, the national average has jumped by 15% ($0.31 per mile), leaving it only $0.04 shy of the Week 22 record established in 2021.
Key segment performance highlights included:
- High-Volume Lanes: The average rate for the top 50 lanes monitored by DAT climbed by $0.07 per mile to $2.75, placing it $0.43 higher than the overall 7-day national average.
- Midwest Region: Serving as a vital economic indicator and managing nearly half of the nation’s load volume, this 13-state region saw rates rise by $0.03 per mile to an average of $2.67, continuing a trend of robust activity in its primary corridors.
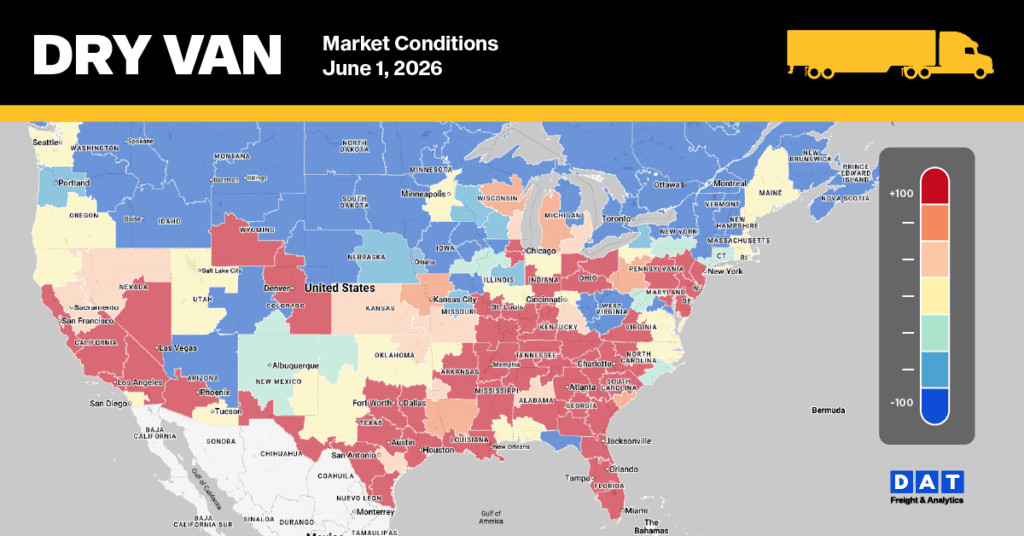
Dry Van Market Conditions
As the market saw a gradual return of capacity following the holiday, the national dry van load-to-truck ratio climbed 18% to reach 18.53 last week. Despite a 10% weekly decline in load postings caused by the truncated Memorial Day workweek, volume remained 63% higher than previous-year levels. Additionally, when removing pandemic-affected data from 2021 and 2022, current equipment availability remains 43% lower than the long-term average established since 2017.