Reefer spot rates
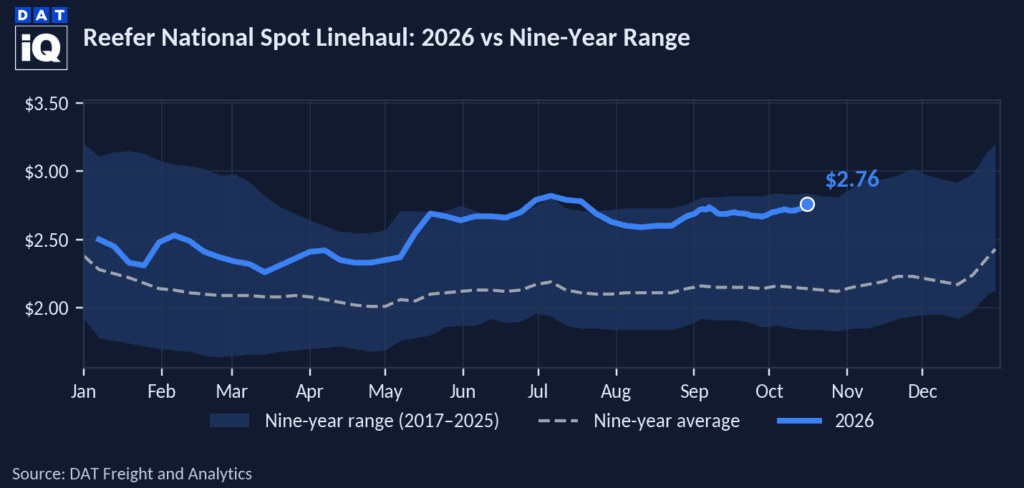
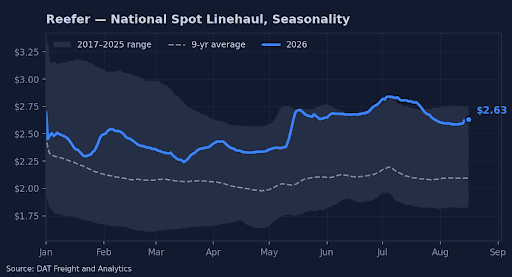
Reefer national spot linehaul rates paid to carriers averaged $2.63 per mile last week (minus fuel), down 0.2%, or $0.01 per mile, from the prior week. That leaves rates 33.7%, or $0.66 per mile, above the same week a year ago. Against the nine-year seasonal pattern, the current rate runs 25.4%, or $0.53 per mile, above the nine-year seasonal average of $2.09 per mile, near the top of the historical range.
Get the clearest, most accurate view of the truckload marketplace with data from DAT iQ.
Tune into DAT iQ Live, live on YouTube or LinkedIn, 10am ET every Tuesday.
Bellwether States
The 10 reefer bellwether states posted a moves-weighted outbound rate of $3.60 per mile minus fuel, down 0.4%, or $0.01 per mile, week over week and up 40.6%, or $1.04 per mile, year over year. The roster carried 41.0% of all U.S. state-outbound reefer loads, at the upper end of its 38 to 40% baseline.
| Reefer — Top 10 Origins by Rate Per Mile · Week Ending August 14, 2026 | ||||
| Rank | Origin Region | Avg RPM | WoW % | YoY % |
|---|---|---|---|---|
| 1 | Lower Midwest | $3.16 | -1.3% | +38.0% |
| 2 | Great Lakes | $3.13 | +1.3% | +38.0% |
| 3 | Ohio River | $3.11 | -2.8% | +37.2% |
| 4 | California | $2.84 | -4.4% | +27.1% |
| 5 | Upper Atlantic | $2.63 | +3.8% | +36.6% |
| 6 | Southeast | $2.54 | -4.0% | +34.7% |
| 7 | South Central | $2.45 | -2.6% | +33.2% |
| 8 | Pacific Northwest | $2.44 | -2.1% | +22.7% |
| 9 | Carolinas | $2.38 | -5.6% | +34.2% |
| 10 | Lower Mountain | $2.36 | +0.0% | +26.3% |
The top 10 origins carried 84.0% of all U.S. outbound loads moved. Upper Atlantic led week over week at +3.8%, while most leading origins eased from the prior week as summer volumes softened.
Market conditions
Load posts were down 6.0% week over week and up 25.1% year over year, while truck posts were down 5.7% week over week and down 30.5% year over year. With freight easing faster than capacity, the load-to-truck ratio eased to 18.62, down from 18.66 a week earlier but still well above 10.34 a year ago.
Rate forecast
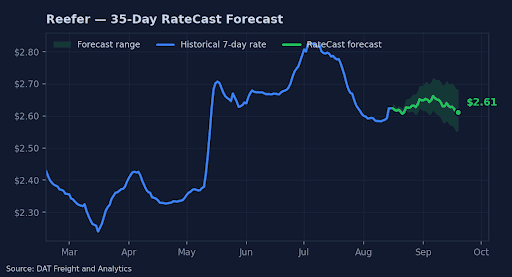
The 35-day DAT Rate Forecast puts reefer spot linehaul minus fuel at $2.61 per mile in mid-September, within an uncertainty band of about plus or minus $0.06 per mile (2.4% of the forecast point). Across equipment, the reefer band ranks narrowest. That end-of-forecast rate stands about $0.61 per mile above the actual rate near the same date a year earlier ($2.00 per mile).
Freight demand outlook
The big picture
This was a cooling week on the spot board — but only if you’re looking at the last seven days. Almost every West Coast lane drifted flat-to-down week over week, South Texas gave back ground across the board, and the marquee California districts printed a string of mid-teens declines. The exception jumped off the page: the desert district (Imperial/Coachella/Arizona) snapped its New York lane +18% in a single week, the largest upside move on the report.
The bigger story is the one that doesn’t move week to week: the gap over last August. Nearly every lane that carried a rate in both years is sitting well above 2025 — California produce running +24% to +63% YoY, Vidalia onions +27% to +49%, Delmarva watermelons up to +51%, and the Pacific Northwest up to +59%. The weekly softening is real, but it’s happening a full tier above where this same week priced a year ago.
California citrus: Soft week, still towering over 2025
The South & Central District citrus complex (grapefruit, lemons, oranges) was mostly flat-to-soft on the week, with Chicago the lone outlier to the upside at +10% and New York and Philadelphia the softest. Against last August, though, every lane is dramatically higher — Seattle and Atlanta both more than 60% over 2025.
The same district also moves a broad mixed vegetable and avocado basket (anise, artichokes, avocados, brassicas, celery, lettuces, radishes, spinach) on a separate set of lanes. Those pulled back modestly on the week, Baltimore the softest:
California desert: One lane runs against the grain
The Imperial/Coachella/Arizona district (crossings through Calexico and San Luis) carries the widest lettuce-and-berry vegetable slate on the board, and most of it drifted lower — Atlanta off -8%, Dallas -5%. Then New York went the other way and jumped +18%, far and away the largest single-week gain anywhere on this report.
California coast: Broadly softer, Santa Maria leads the pullback
The coastal lettuce/berry districts all leaned lower. Santa Maria took the sharpest cuts of the week — Seattle -23%, Chicago -15%, Boston -14% — even as its two eastern lanes with a year-ago match sit a third or more above 2025. Salinas-Watsonville held New York flat and eased elsewhere. Oxnard (celery, greens, strawberries) softened but still runs near 30% over last August.
Mexico crossings through South Texas: Softening across the oard
South Texas gave back rate across nearly every lane, with Baltimore off -17% and New York -10%. The district is carrying its full summer Mexican-crossing basket (peppers of every stripe, tomatoes, limes, cucumbers, pineapples, melons). Where a year-ago match exists the picture is mixed: most lanes still run well above 2025, but Baltimore has actually slipped below last August.
Eastern melons & Vidalia onions: Flat weeks, wide year-over-year gaps
Delmarva watermelons firmed on the short eastern hauls — Baltimore +8%, Philadelphia +7%, Atlanta +3% — while the longer runs eased. Every Delmarva lane sits sharply above last August, Atlanta the widest at +51%. Vidalia onions were the definition of a quiet week: every lane printed flat week over week. But the year-ago comparison is anything but quiet, with Dallas +49% and most other lanes north of 30%. North Carolina watermelons had no prior-year counterpart, so those show the weekly move alone.
Pacific Northwest: Yakima adds stone fruit
Yakima and Wenatchee widened their basket this week, adding peaches and prunes to the standing apples/blueberries/cherries/pears/rhubarb slate as Northwest stone fruit comes on. Against last August the district runs well above 2025 on every lane, led by the short Los Angeles run at +59% and New York at +36%.
What this means for carriers, shippers & brokers
Carriers. The single best eastbound upside on the board this week is the desert district’s New York lane at +18% — if you’re repositioning out of Imperial/Coachella/Arizona, that’s the lane carrying the premium. Elsewhere on the West Coast, expect to work harder for the same money: Santa Maria and the South/Central citrus lanes are softening, and the citrus capacity crunch that supported rates a week ago has eased, so the leverage that came with those Shortage tags is fading. Vidalia is a steady, no-drama book this week — flat rates, Adequate trucks. The year-over-year backdrop is your friend everywhere: even on a soft week, almost every lane prices a full tier above August 2025.
CVSA Brake Safety Week runs Aug. 23–29, a North America–wide roadside brake-inspection blitz that can pull equipment out of service. Carriers running long California eastbound lanes into that window should build in inspection-readiness and a little schedule cushion.
Shippers. West Coast produce is cheaper to cover than it was a week ago, and the easing of the California citrus availability tags means you should see less resistance getting those SoCal citrus loads booked than during last week’s Shortage conditions. South Texas has softened materially — Baltimore and New York especially — so there’s negotiating room on Mexican-crossing freight. But temper the budget: on a year-over-year basis you are still paying +24% to +60%+ over last August across most origins, and Vidalia and Delmarva are up 30–50%. The weekly dip is not a reset.
Brokers. This is a spread-compression week on the West Coast — margins are getting thinner as coastal rates drift down, so watch the exceptions rather than the averages. The Imperial/Coachella New York lane (+18%) and the South/Central citrus Chicago lane (+10%) are the two places rate moved up meaningfully; everything else is flat-to-soft. South Texas coming off across the board frees up quotable capacity on those southern lanes. Use the year-over-year gap as your framing anchor with customers: even after this week’s pullback, lanes are pricing well above where they sat a year ago, which is the context that keeps a softer weekly quote from looking like a floor. CVSA Brake Safety Week is next week – get in early.
About These Rates
Source: USDA AMS Specialty Crops National Truck Rate Report, published August 19, 2026 (prices for Tuesday, August 18, 2026). Week-over-week changes are measured against Tuesday, August 11, 2026; year-over-year changes against Tuesday, August 19, 2025.
Rates quoted represent open (spot) market sales that shippers or receivers pay, depending on the basis of sale, per load, including brokers’ fees for shipments in truckload volume to a single destination. Extra charges for delivery to terminal markets, multi-pickup and multi-drop shipments are not included unless otherwise stated. Rates are based on the most usual loads in 48-53 foot refrigerated trailers from the origin shipping area to the destination receiving city. The ten cities of destination are Atlanta, Georgia; Baltimore, Maryland; Boston, Massachusetts; Chicago, Illinois; Dallas, Texas; Los Angeles, California; Miami, Florida; New York, New York; Philadelphia, Pennsylvania; and Seattle, Washington.
USDA Truck Availability Rating (1–5): 1 = Surplus, 2 = Slight Surplus, 3 = Adequate, 4 = Slight Shortage, 5 = Shortage.