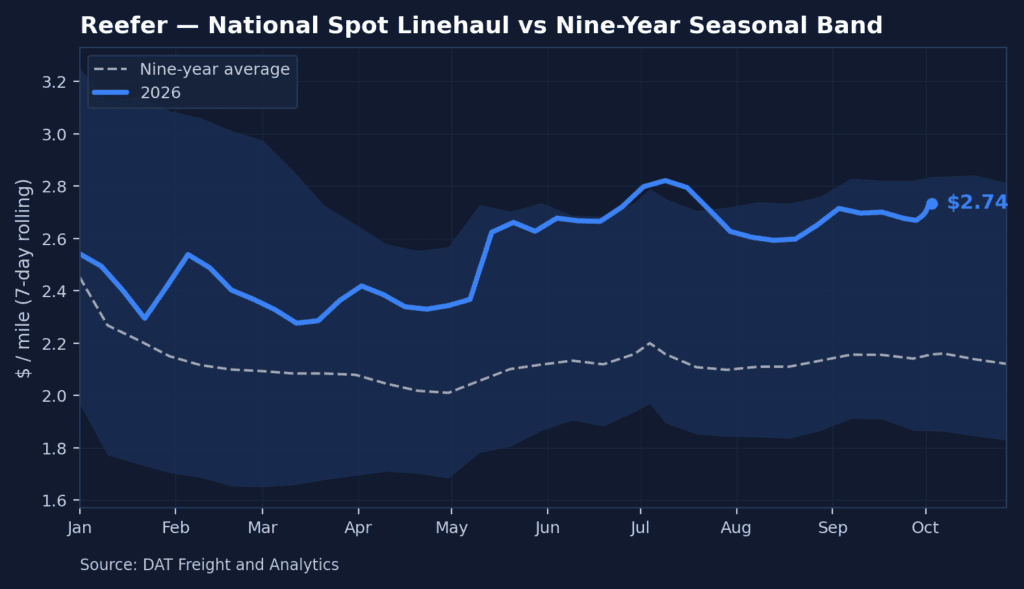
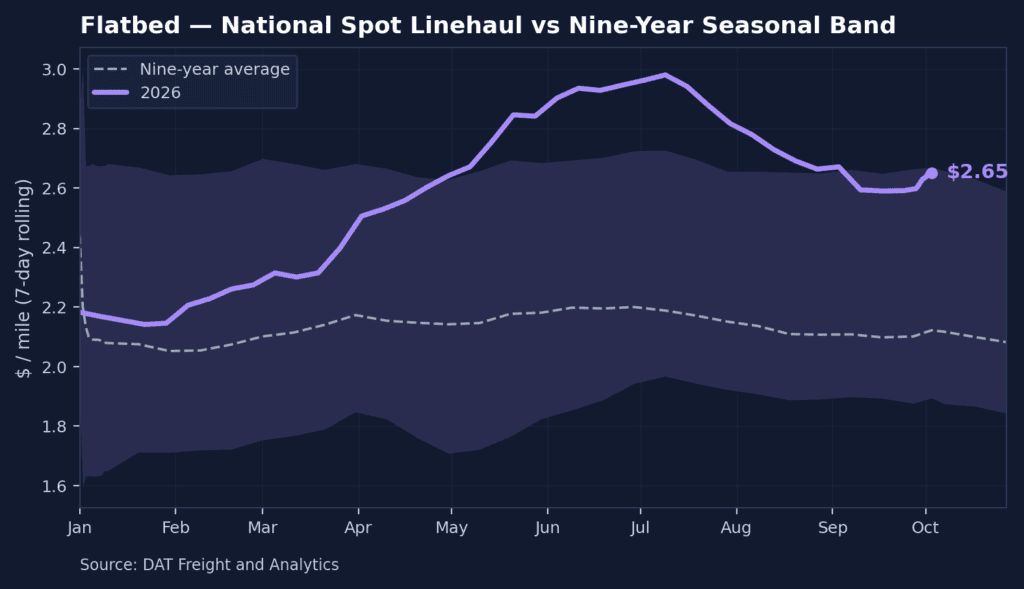
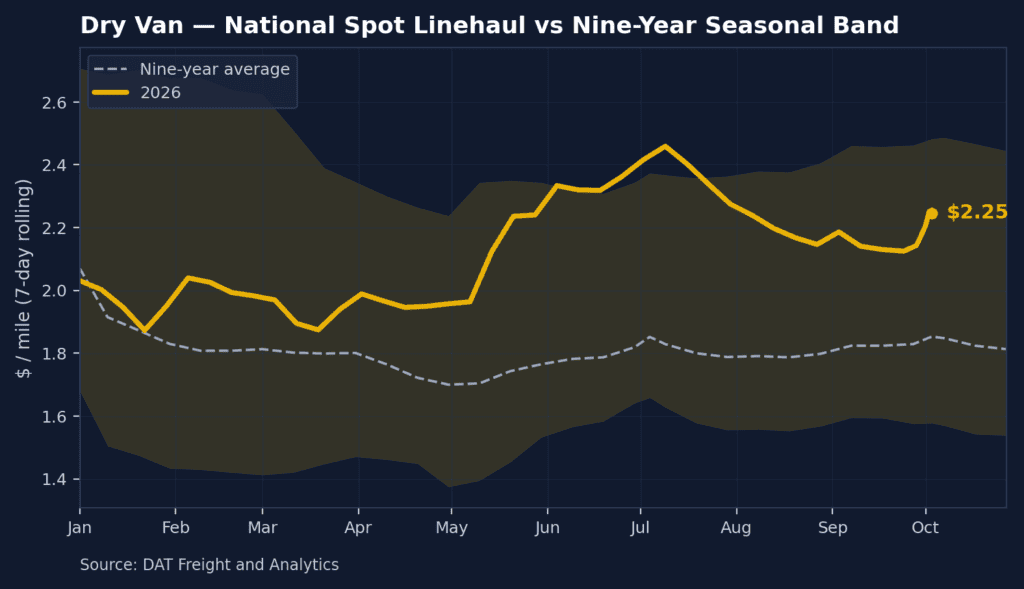
Dry van spot linehaul rates paid to carriers averaged $2.25 per mile last week, minus fuel, down 1.3%, or $0.03 per mile, from the prior week. Rates climbed 38.4%, or $0.62 per mile, year over year and held 25.8%, or $0.46 per mile, above the nine-year seasonal average of $1.78 per mile, near the top of the historical range.
All rates cited are linehaul only. They exclude fuel costs and surcharges unless otherwise noted.
Get the clearest, most accurate view of the truckload marketplace with data from DAT iQ.
Tune into DAT iQ Live, live on YouTube or LinkedIn, 10am ET every Tuesday.
Bellwether states
The 10 dry van bellwether states posted a moves-weighted outbound rate of $2.97 per mile this week, down 1.1%, or $0.03 per mile, week over week and up 44.0%, or $0.91 per mile, year over year. The roster carried 35.5% of all U.S. state-outbound dry van loads, in line with its recent baseline near 35%.
Regional rate trends
| Dry Van — Top 10 Origins by Rate Per Mile · Week Ending August 14, 2026 | ||||
|---|---|---|---|---|
| Rank | Origin Region | Avg RPM | WoW % | YoY % |
| 1 | Ohio River | $2.53 | -0.9% | +40.3% |
| 2 | California | $2.51 | -3.6% | +34.6% |
| 3 | Great Lakes | $2.46 | +0.3% | +36.1% |
| 4 | Lower Midwest | $2.32 | -1.5% | +34.9% |
| 5 | Southeast | $2.32 | -4.8% | +42.5% |
| 6 | Carolinas | $2.29 | -3.6% | +41.0% |
| 7 | Lower Atlantic | $2.22 | -1.7% | +38.2% |
| 8 | Upper Atlantic | $2.14 | +0.5% | +30.7% |
| 9 | South Central | $2.13 | -6.9% | +31.3% |
| 10 | Florida-So Georgia | $1.59 | -4.6% | +37.5% |
The top 10 origins carried 87.6% of all U.S. outbound loads moved in the week. Great Lakes led week over week at +0.3%, while most leading origins eased from the prior week as summer volumes softened.
Market conditions
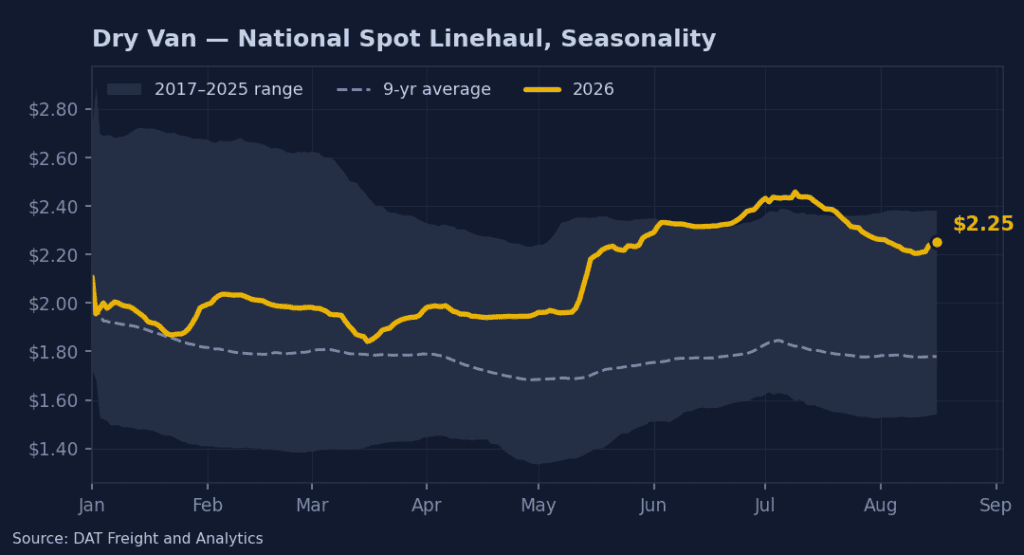
Load posts were down 1.5% week over week and up 27.2% year over year, while truck posts were down 0.8% week over week and down 26.4% year over year. With freight easing faster than capacity, the load-to-truck ratio eased to 9.98, down from 10.05 a week earlier but still well above 5.77 a year ago.
Short-term outlook
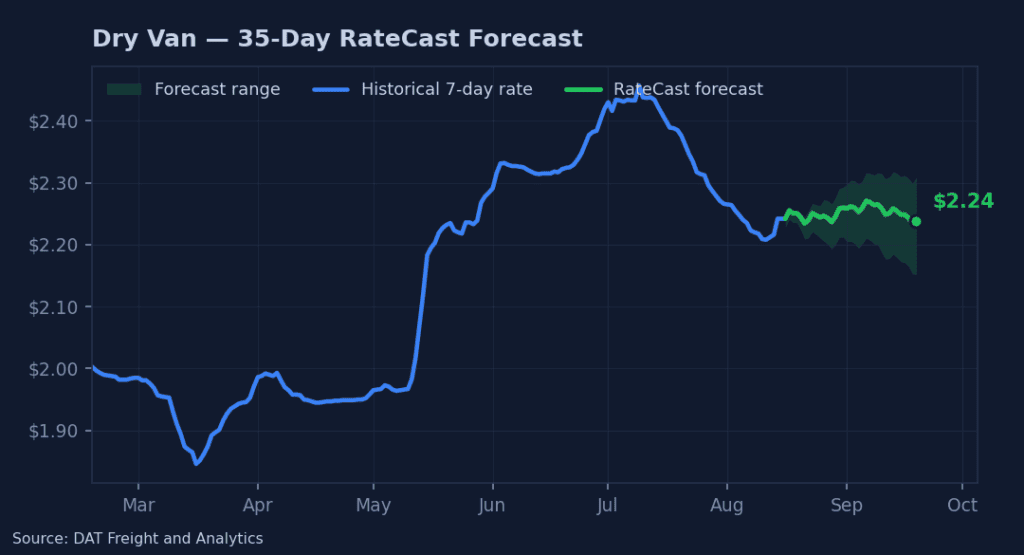
The 35-day DAT Rate Forecast puts dry van spot linehaul at $2.24 per mile in mid-September, within an uncertainty band of about plus or minus $0.08 per mile (3.5% of the forecast point). Across equipment, the dry van band ranks widest. That end-of-forecast rate stands about $0.60 per mile above the actual rate near the same date a year earlier ($1.64 per mile).