Reefer spot rates
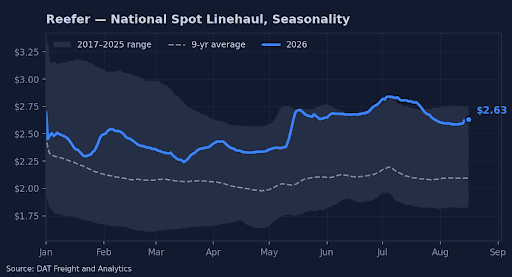
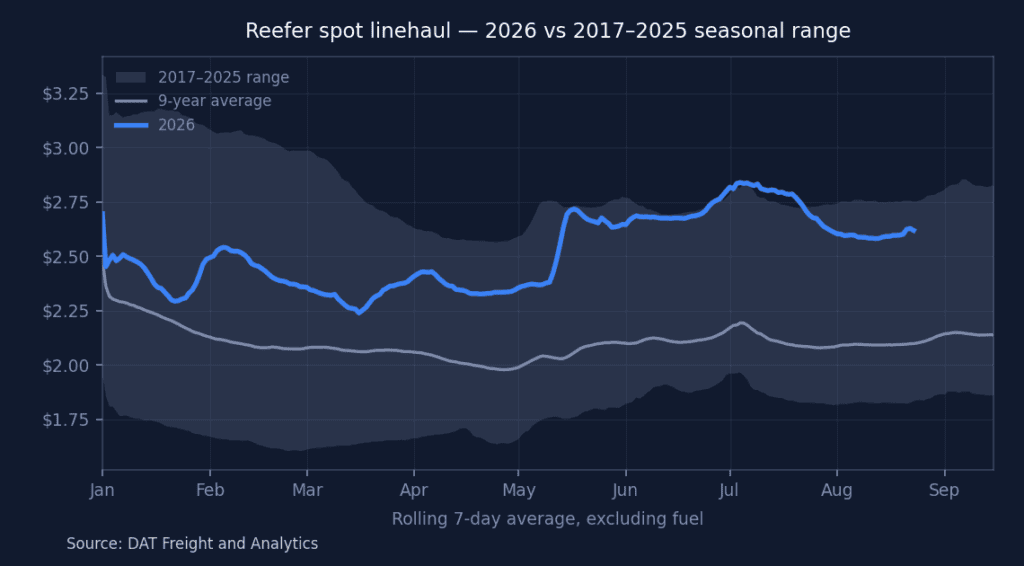
Reefer spot linehaul rates paid to carriers averaged $2.63 per mile this week, minus fuel, down 0.2%, or less than a cent per mile, from the prior week. Rates climbed 32.5%, or $0.64 per mile, year over year and held 24.8%, or $0.52 per mile, above the nine-year seasonal average of $2.10 per mile, near the top of the historical range.
All rates cited are linehaul only. They exclude fuel costs and surcharges unless otherwise noted.
Get the clearest, most accurate view of the truckload marketplace with data from DAT iQ.
Tune into DAT iQ Live, live on YouTube or LinkedIn, 10am ET every Tuesday.
Bellwether states
The 10 reefer bellwether states posted a moves-weighted outbound rate of $3.65 per mile this week, up 1.1%, or $0.04 per mile, week over week and up 40.5%, or $1.05 per mile, year over year. The roster carried 42.3% of all U.S. state-outbound reefer loads, at the upper end of its 38 to 42% baseline.
Regional rate trends
| Reefer — Top 10 Origins by Rate Per Mile · Week Ending August 21, 2026 | ||||
|---|---|---|---|---|
| Rank | Origin Region | Avg RPM | WoW % | YoY % |
| 1 | Great Lakes | $3.15 | +0.9% | +35.7% |
| 2 | Upper Midwest | $3.13 | -2.0% | +32.5% |
| 3 | Lower Midwest | $3.13 | -0.9% | +36.4% |
| 4 | Ohio River | $3.11 | -0.2% | +37.6% |
| 5 | California | $2.82 | -0.4% | +29.4% |
| 6 | Upper Atlantic | $2.69 | +2.3% | +42.3% |
| 7 | Southeast | $2.45 | -3.7% | +30.0% |
| 8 | South Central | $2.35 | -4.2% | +29.0% |
| 9 | Lower Mountain | $2.27 | -3.6% | +21.5% |
| 10 | Florida-So Georgia | $1.50 | -2.3% | +30.3% |
The top 10 origins carried 84.0% of all U.S. outbound loads moved in the week. Upper Atlantic led week over week at +2.3%, while most leading origins eased from the prior week as summer volumes softened.
Market conditions
Load posts were up 10.9% week over week and up 38.6% year over year, while truck posts were down 5.2% week over week and down 31.3% year over year. With capacity pulling back faster than freight, the load-to-truck ratio firmed to 21.10, up from 18.03 a week earlier and well above 10.45 a year ago.
Short-term outlook
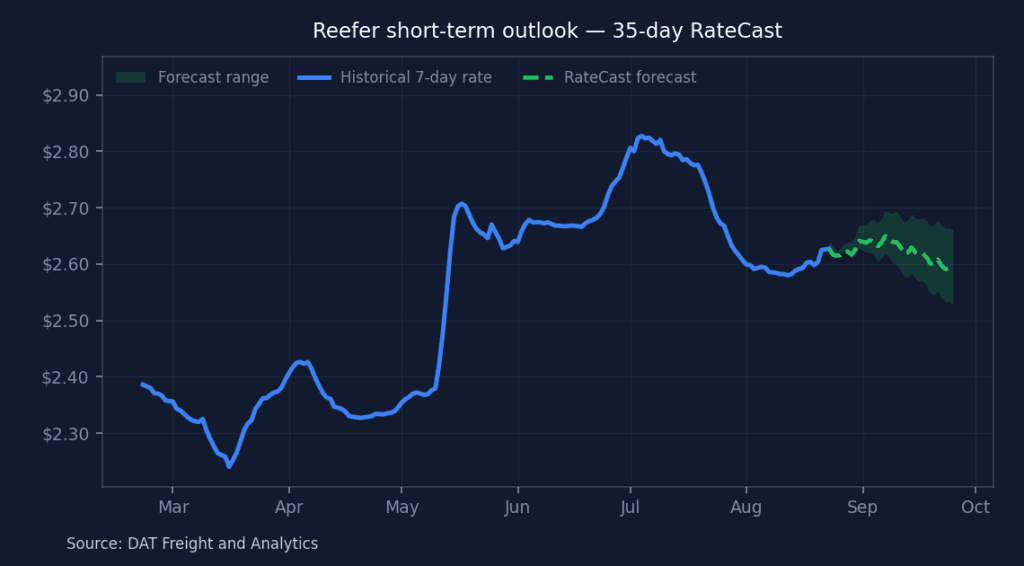
The 35-day DAT Rate Forecast puts reefer spot linehaul at $2.59 per mile in late September, within an uncertainty band of about plus or minus $0.07 per mile (2.6% of the forecast point). That end-of-forecast rate stands about $0.58 per mile above the actual rate near the same date a year earlier ($2.01 per mile).
Freight demand outlook
The big picture
Produce reefer rates turned back up last week as carriers took time off ahead of Brake Safety Week to avoid roadside enforcement and resulting delays. The move was led by a sharp Santa Maria, CA whipsaw — the district that took the steepest cuts the week before swung hard the other way, with Boston jumping 32% to a $13,400–$14,100 lane and Baltimore up 10%. The Pacific Northwest joined in: Yakima–Wenatchee rates firmed across the board (Chicago +15%, Miami +12%, Philadelphia +11%, Boston +10%). Eastern watermelons out of DelMarVa surged (Chicago +17%, Atlanta +14%, Philadelphia +13%). The clear laggard was South Texas, which kept sliding for a second straight week, and the desert (Imperial–Coachella) gave back the prior week’s New York spike, easing on most lanes.
The year-over-year picture is unchanged in character: nearly every lane with a match in both years sits a full tier above August 2025 — California produce up 19% to 63%, DelMarVa watermelons up 47% to 70%, Vidalia onions up 27% to 49%, and Yakima tree fruit up 22% to 59% — despite USDA tonnage running about 8% lower year to date. Last week’s firming during Brake Safety Week, which affects long-haul California-based produce carriers the most, came on top of that already-elevated base rather than closing the gap to it.
California citrus and mixed vegetables
The South and Central California citrus complex (grapefruit, lemons, oranges) was mixed on the week — eastern markets firmed (New York +2%, Philadelphia +1%, Miami +3%, Dallas +4%) while Baltimore fell 13%, Chicago 8%, and Boston 6%. Year over year, every lane towers over 2025, with Seattle and Atlanta both around +60%. The district’s separate mixed-vegetable and avocado basket firmed a few points across its four lanes; those carry no like-for-like 2025 comparison, so they show the week-over-week figure only.
Pacific Northwest tree fruit
Yakima and Wenatchee published week-over-week figures again after a blank week — the district had added peaches and prunes to its apple, blueberry, cherry, pear, and rhubarb slate — and the whole board firmed as Northwest stone fruit and the new apple crop moved in volume. Chicago led at +15%, with Miami +12%, Philadelphia +11%, and Boston +10% all posting double-digit weekly gains. Against last August, every lane ran higher, topped by the short Los Angeles haul at +59% and Philadelphia at +44%. The move marks the early stage of the fall produce ramp, with reefer outbound rates already holding 27% above a year ago.
Eastern watermelons
The DelMarVa watermelon deal (Delaware, Maryland, Eastern Shore Virginia) jumped as the eastern season ran hot — Chicago +17%, Atlanta +14%, Philadelphia +13%, and New York +10%, with only Baltimore flat. Every lane sits dramatically above last August, led by Chicago at +70%. North Carolina watermelons, which have no year-ago counterpart in the comparison, were steadier and mixed on the week.
Imperial–Coachella and western Arizona
The desert district (Imperial and Coachella Valleys, central and western Arizona, and Mexico crossings through Calexico and San Luis) eased on nearly every lane, unwinding part of the prior week’s move. New York, which had spiked 18% into August 18, came off 3%, and the softest lanes were Dallas and Seattle, each down 8%. Only Chicago firmed, up 4%. There is no year-ago counterpart for this origin, so these lanes show the weekly move alone.
Vidalia onions
Vidalia printed flat on every lane for a second straight week. The year-ago comparison tells a different story, though — Dallas +49%, Baltimore +45%, New York +44%, and most other lanes north of 30%. The Georgia onion deal continues to ship to all ten markets at a materially higher baseline than a year ago.
South Texas
The Rio Grande Valley crossing basket softened again, extending the prior week’s decline; import volumes are running roughly 30% below last July. Boston led the drop at -9% and Philadelphia eased 5%, with several lanes flat and none firming. Year over year the picture is mixed: most lanes still run above 2025, led by Atlanta and Philadelphia at +21%, but Baltimore has slipped 10% below last August.
What this means for carriers, shippers, and brokers
Carriers. The upside sits on the coast and in the Northwest. Santa Maria snapped back hard — the Boston lane now tops $14,000 and Baltimore ran +10% — while Yakima–Wenatchee tree fruit firmed double digits into Chicago, Miami, Philadelphia, and Boston as the fall stone-fruit and apple push ramps. DelMarVa watermelons are climbing fast on the short eastern hauls. The desert has cooled after the prior week’s New York run, and South Texas is the one region to approach cautiously, with rates now down two weeks running. The year-over-year backdrop remains a tailwind almost everywhere.
Shippers. Budget for a market that firmed last week and still sits far above a year ago. Coastal California, the Pacific Northwest, and eastern watermelons all moved up, so the discounts available the week before have largely closed. The softer pockets are South Texas and the desert lanes. On a year-over-year basis, expect to pay 19% to 70% over last August across most origins, with one exception: South Texas into Baltimore, down 10% from a year ago. Rates could cool once Brake Safety Week enforcement eases.
Brokers. The story flipped from compression to firming, and the spread is widest in the reversals — quote Santa Maria and Yakima off last week’s levels, not the week before. South Texas easing for a second straight week frees up quotable capacity on southern lanes. Keep the year-over-year gap as the framing anchor with customers, since even the firmer lanes still sit well above where they priced a year ago.
About these rates
Source: DAT iQ | USDA AMS Specialty Crops National Truck Rate Report, published August 26, 2026 (prices for Tuesday, August 25, 2026). Week-over-week changes are measured against Tuesday, August 18, 2026; year-over-year changes against Tuesday, August 26, 2025.
Rates quoted represent open (spot) market sales that shippers or receivers pay, depending on the basis of sale, per load, including brokers’ fees for shipments in truckload volume to a single destination, based on the most usual loads in 48–53 foot refrigerated trailers from the origin shipping area to the destination receiving city.