Flatbed spot rates
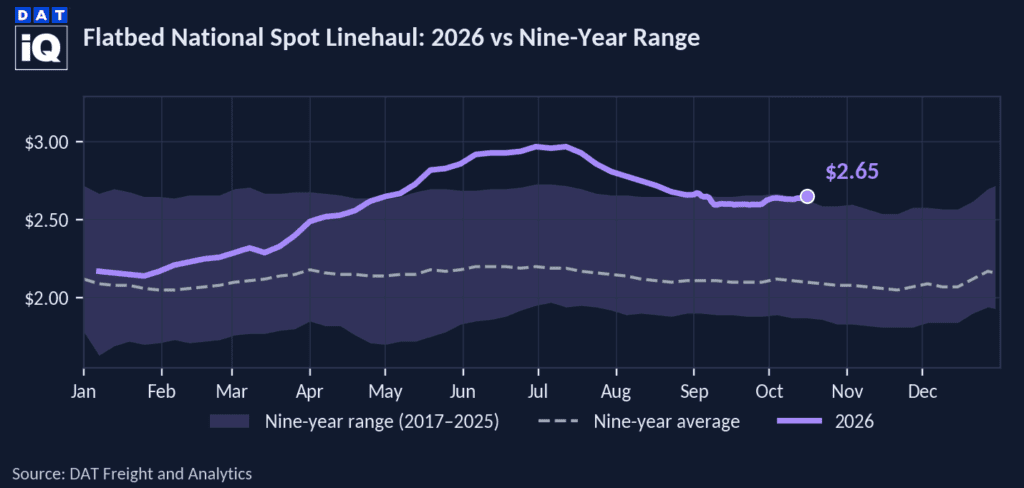
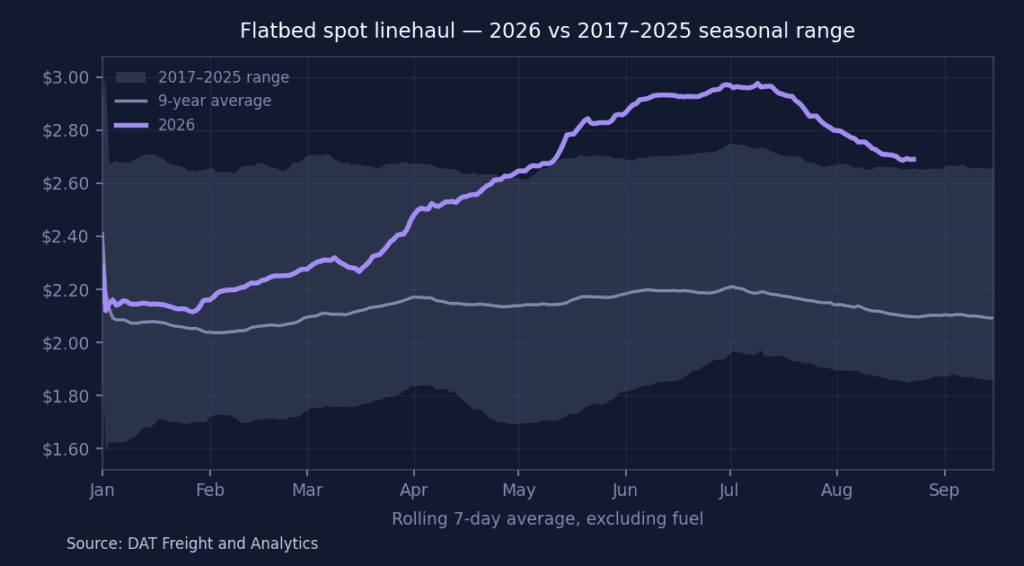
Flatbed spot linehaul rates paid to carriers averaged $2.70 per mile this week, minus fuel, down 0.8%, or $0.02 per mile, from the prior week. Rates climbed 35.1%, or $0.70 per mile, year over year and held 28.3%, or $0.59 per mile, above the nine-year seasonal average of $2.10 per mile, near the top of the historical range.
All rates cited are linehaul only. They exclude fuel costs and surcharges unless otherwise noted.
Get the clearest, most accurate view of the truckload marketplace with data from DAT iQ.
Tune into DAT iQ Live, live on YouTube or LinkedIn, 10am ET every Tuesday.
Bellwether states
The 10 flatbed bellwether states posted a moves-weighted outbound rate of $3.37 per mile this week, down 1.0%, or $0.04 per mile, week over week and up 34.0%, or $0.85 per mile, year over year. The roster carried 52.4% of all U.S. state-outbound flatbed loads, in line with its recent baseline near 52%.
Regional rate trends
| Flatbed — Top 10 Origins by Rate Per Mile · Week Ending August 21, 2026 | ||||
|---|---|---|---|---|
| Rank | Origin Region | Avg RPM | WoW % | YoY % |
| 1 | Ohio River | $3.21 | +0.8% | +44.2% |
| 2 | Southeast | $3.13 | -2.5% | +39.1% |
| 3 | Carolinas | $2.93 | -0.1% | +40.4% |
| 4 | Great Lakes | $2.73 | -0.3% | +33.4% |
| 5 | South Central | $2.62 | -3.5% | +32.1% |
| 6 | Lower Midwest | $2.59 | -2.6% | +33.4% |
| 7 | Upper Atlantic | $2.53 | +3.9% | +32.5% |
| 8 | California | $2.42 | -4.4% | +42.9% |
| 9 | Florida-So Georgia | $2.34 | -0.9% | +34.6% |
| 10 | Lower Mountain | $1.90 | +0.4% | +31.7% |
The top 10 origins carried 87.5% of all U.S. outbound loads moved in the week. Upper Atlantic led week over week at +3.9%, while most leading origins eased from the prior week as summer volumes softened.
Market conditions
Load posts were up 2.6% week over week and up 30.1% year over year, while truck posts were down 5.4% week over week and down 26.3% year over year. With capacity pulling back faster than freight, the load-to-truck ratio firmed to 36.11, up from 33.31 a week earlier and well above 20.44 a year ago.
Short-term outlook
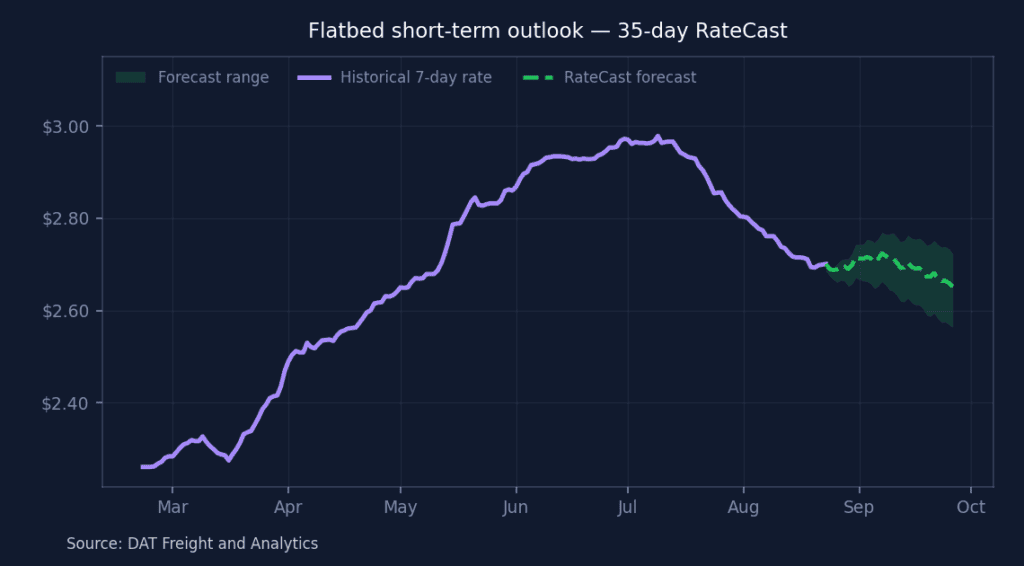
The 35-day DAT Rate Forecast puts flatbed spot linehaul at $2.65 per mile in late September, within an uncertainty band of about plus or minus $0.08 per mile (3.0% of the forecast point). That end-of-forecast rate stands about $0.61 per mile above the actual rate near the same date a year earlier ($2.04 per mile).
Freight demand outlook
Single-family housing starts fell to a seasonally adjusted annual rate of 808,000 in July, down 9.9% from June — the third decline in the past four months — as mortgage rates near 6.7% and affordability keep buyers on the sidelines. That’s a signal worth watching for flatbed carriers: single-family building is one of the more reliable leading indicators for open-deck freight, since every start pulls lumber, drywall, roofing, trusses, and other building materials onto flatbed trailers. When ground-breaking slows, that softness tends to show up in flatbed load volumes over the following one to two quarters, so July’s print points to a soft patch for construction-linked freight heading into the back half of the year.
The read isn’t all one direction, though. Building permits rose 5.0% in July to a 1.443 million annual rate, and single-family authorizations climbed 2.5% to 894,000. Permits lead starts, so that gap suggests builders are pausing rather than pulling out, leaving room for starts — and the flatbed demand that follows them — to rebound later in the year if rates ease. Carriers running open-deck should treat the current stretch as a demand headwind to plan around, not a structural break, and watch permits and mortgage rates for the first sign the construction pipeline turns back up.