National reefer spot rates
Reefer spot linehaul rates paid to carriers averaged $2.69 per mile this week, minus fuel, up 2.1%, or $0.06 per mile, from the prior week. Rates climbed 31.2%, or $0.64 per mile, year over year and held 25.6%, or $0.55 per mile, above the nine-year seasonal average of $2.13 per mile, near the top of the historical range.
All rates cited are linehaul only. They exclude fuel costs and surcharges unless otherwise noted.
Get the clearest, most accurate view of the truckload marketplace with data from DAT iQ.
Tune into DAT iQ Live, live on YouTube or LinkedIn, 10am ET every Tuesday.
Bellwether states
The 10 reefer bellwether states posted a moves-weighted outbound rate of $3.67 per mile this week, up 1.7%, or $0.06 per mile, week over week, and up 37.6%, or $1.00 per mile, year over year. The roster carried 41.3% of all U.S. state-outbound reefer loads, at the upper end of its 38 to 42% baseline.
Regional rate trends
| Reefer — Top 10 Origins by Rate Per Mile · Week Ending August 28, 2026 | ||||
|---|---|---|---|---|
| Rank | Origin Region | Avg RPM | WoW % | YoY % |
| 1 | Great Lakes | $3.42 | +2.8% | +41.8% |
| 2 | Upper Midwest | $3.36 | +3.9% | +37.8% |
| 3 | Ohio River | $3.30 | +0.5% | +40.1% |
| 4 | Lower Midwest | $3.20 | -0.2% | +35.2% |
| 5 | California | $3.01 | +2.3% | +33.2% |
| 6 | Upper Atlantic | $2.88 | +2.7% | +45.7% |
| 7 | Pacific Northwest | $2.62 | +5.7% | +22.5% |
| 8 | Southeast | $2.45 | -2.5% | +32.5% |
| 9 | South Central | $2.32 | -3.9% | +24.7% |
| 10 | Lower Mountain | $2.29 | -1.0% | +21.0% |
The top 10 origins carried 84.3% of all U.S. outbound loads moved this week. Pacific Northwest led week over week, up 5.7%, with Midwest corridors firming while several southern origins eased.
Market conditions

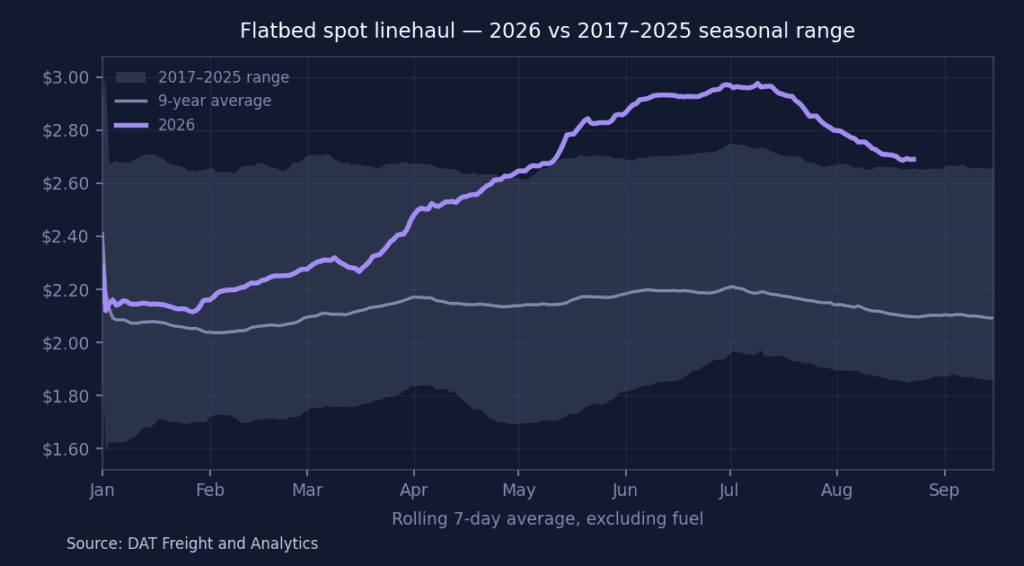
Reefer national spot linehaul, 7-day rolling average, 2026 versus the 2017–2025 range.
Reefer load posts advanced 4.7% week over week and 26.5% year over year, and capacity thinned at the same time, with truck posts down 8.7% on the week and 31.8% lower than a year ago. That combination tightened the load-to-truck ratio to 23.55, up from 20.55 a week earlier and well above the 12.71 of last year.
The big picture
The headline this week isn’t the rates, it’s the trucks. The entire California produce complex flipped from adequate to slight shortage of trucks in a single week even though California produce volumes are almost 10% lower year to date. Imperial-Coachella, Kern, Oxnard, Salinas-Watsonville, and Santa Maria all tightened off last week’s adequate truck supply reads, and South and Central joined them, with its citrus book into Miami and New York pushed all the way to shortage. Add Delmarva, at a shortage of trucks into Atlanta, and Yakima, at a shortage into Miami, and three districts are now showing outright shortage. The only markets that didn’t tighten were Georgia (Vidalia) and North Carolina, which held adequate, and the South Texas crossings, which stayed at surplus.
The tightening is concentrated where it matters most: the California long-haul market. That’s the sharpest one-week western capacity swing seen in months, and it lands right on top of last week’s Brake Safety Week enforcement window (August 24-29), which sits between this report’s pricing date and the prior week’s.
Here’s the wrinkle worth flagging honestly: capacity tightened hard, but spot rates haven’t caught up yet. California week-over-week moves are flat to down across most lanes. Imperial-Coachella into the Northeast fell 9% to 10%, and Santa Maria to Boston dropped 20%. So this is a capacity signal running ahead of the rate response. Either rates follow next week as the tighter market gets priced in, or post-Labor Day demand is soft enough to absorb the pullback. Either way, the year-ago picture is unambiguous: nearly every lane with a 2025 quote is up 30% to 45%.
The capacity pullback lines up with last week’s CVSA Brake Safety Week and the heightened credential, English-language-proficiency, and immigration-status scrutiny that accompanied it. West Coast long-haul produce carriers, a workforce with heavy minority-owned representation, face concentrated roadside-inspection exposure on the limited I-80, I-40, I-8, and I-15 routing east, which is a plausible driver of why the tightening showed up in the California deck specifically and not in the shorter-haul South Texas crossings.
California — South and Central district
The deepest book on the board, and now the tightest, sits at slight shortage across the vegetable basket, with the citrus book at shortage into Miami and New York. The vegetable, avocado, and citrus mix (anise, artichokes, avocados, broccoli, cauliflower, celery, greens, lettuces, radishes, and spinach) posted the highest single lane anywhere, New York at $11,100 to $11,800. The separate citrus book (grapefruit, lemons, and oranges) carries the biggest year-ago premium on the map: Atlanta citrus up 64% against last September, with Dallas and Seattle both north of 50%.
Mexico crossings through South Texas
The exception to the western tightening: South Texas held surplus and firmed on rate anyway as cross-border volumes rose 7% week over week. The border mixed-vegetable deck (peppers, tomatoes, cucumbers, limes, citrus, watermelons, and more) pushed up across the board, with Los Angeles up 16%, Baltimore up 14%, and Boston and Dallas both up 8%. That’s the tell that this week’s capacity story is a West Coast long-haul phenomenon, not a general border-region one; the shorter-haul Texas crossings kept ample trucks. Even after the gains, eastern South Texas lanes carry only a slim year-ago premium (Baltimore up 2% year over year, Miami up 9%), a fraction of California’s 30% to 45%. The western pull, with Los Angeles up 32% year over year, is the outlier.
Washington — Yakima Valley and Wenatchee
Slight shortage, with Miami at shortage, one of three shortage lanes on the board. Apples, blueberries, cherries, peaches, pears, prunes, and rhubarb move through this district. It was a flat week on rate, with every lane printing flat or within a point, but riding a large year-ago premium top to bottom, from Atlanta up 22% to Los Angeles up 59%, with Philadelphia up 44%. Steady at a high level on a tight truck picture.
Georgia — Vidalia district (dry onions)
Held adequate supply of trucks, one of only two districts that didn’t tighten. It was a second straight soft week on rate: nearly every lane ticked down, with Atlanta off 7% and Baltimore and Dallas down 5% or worse. But the whole book runs sharply over last year, with most lanes up 35% or better (Dallas up 40%, Baltimore up 39%).
Eastern melons — Delmarva and North Carolina
Delmarva (Delaware, Maryland, and the Eastern Shore of Virginia) held slight shortage with a shortage into Atlanta, already tight last week, so not part of this week’s flip. North Carolina held adequate, the other unchanged district. Both watermelon deals eased on rate as the season winds toward its close: Delmarva fell across every destination (New York down 14%) while running well ahead of last year (Chicago up 64% year over year, Philadelphia up 42%), and North Carolina softened on its longer hauls, with Philadelphia down a hard 17%.
What this means for carriers, shippers, and brokers
Carriers. The California deck tightened to slight shortage across the board this week while rates stayed flat to soft, which means the leverage has shifted your way, but the market hasn’t repriced it yet. If you’re running West Coast produce, hold your number and watch next week: a tight truck picture that rates haven’t caught up to usually resolves upward. The money is still in the Northeast out of California, with $10,000 to $11,800 lanes out of South and Central, Salinas, Santa Maria, and Kern. South Texas is the outlier: still surplus, still the easiest place to find a load, and it firmed anyway (Los Angeles up 16%, Baltimore up 14%).
Shippers. You got a short reprieve on California rates this week; several Northeast lanes are actually cheaper than last week (Imperial-Coachella into New York, Philadelphia, and Baltimore down 9% to 10%), but don’t read it as a trend. Trucks tightened hard across the California complex, and that capacity signal typically leads price. If you have flexibility, book your California east-of-Rockies freight now, before the rate side catches up to the truck side. Melons out of Delmarva and North Carolina are your cheapest declining lanes, and late-season pricing favors buyers there.
Brokers. The setup to watch is the California capacity-rate gap: slight shortage designations against flat-to-down spot rates. That divergence is where next week’s move lives; if capacity stays tight, expect the soft lanes to firm. The arbitrage this week is South Texas (surplus, double-digit week-over-week gains, but still barely over 2025 on the East Coast) versus California and Washington (30% or more over last year). And mind the Santa Maria to Boston whipsaw, up 32% then down 20% in consecutive weeks, a lane that will misprice a spot quote if you’re working off last week’s number.
Spot vs. contract
[Editor’s note: spot-vs-contract figures were not included in this week’s source doc. Analyst to supply before publishing.]
Short-term outlook

The 35-day DAT Rate Forecast puts reefer spot linehaul at $2.58 per mile in early October, within an uncertainty band of about plus or minus $0.06 per mile, or 2.5% of the forecast point. Across equipment, the reefer band ranks narrowest. That end-of-forecast rate stands about $0.52 per mile above the actual rate near the same date a year earlier, $2.07 per mile.