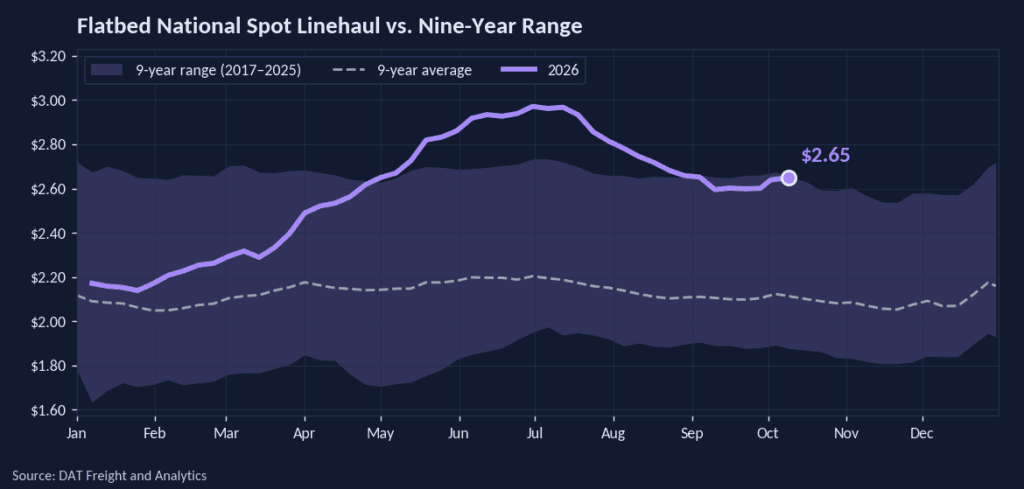
Flatbed spot linehaul rates paid to carriers averaged $2.66 per mile this week, minus fuel, down 0.1%, or less than a cent per mile, from the prior week. Rates climbed 31.2%, or $0.63 per mile, year over year and held 26.1%, or $0.55 per mile, above the nine-year seasonal average of $2.11 per mile, near the top of the historical range.
All rates cited are linehaul only. They exclude fuel costs and surcharges unless otherwise noted.
Get the clearest, most accurate view of the truckload marketplace with data from DAT iQ.
Tune into DAT iQ Live, live on YouTube or LinkedIn, 10am ET every Tuesday.
Bellwether states
The 10 flatbed bellwether states posted a moves-weighted outbound rate of $3.30 per mile this week, down 0.7%, or $0.02 per mile, week over week and up 30.5%, or $0.77 per mile, year over year. The roster carried 51.6% of all U.S. state-outbound flatbed loads, within its 51 to 53% baseline.
Regional rate trends
| Flatbed — Top 10 Origins by Rate Per Mile · Week Ending September 4, 2026 | ||||
|---|---|---|---|---|
| Rank | Origin Region | Avg RPM | WoW % | YoY % |
| 1 | Ohio River | $3.28 | +2.0% | +44.2% |
| 2 | Southeast | $3.25 | -0.7% | +42.4% |
| 3 | Carolinas | $3.01 | -0.9% | +39.7% |
| 4 | Great Lakes | $2.93 | +2.7% | +40.1% |
| 5 | Lower Midwest | $2.69 | +4.2% | +31.9% |
| 6 | South Central | $2.62 | -1.0% | +31.7% |
| 7 | Upper Atlantic | $2.60 | +3.0% | +36.1% |
| 8 | California | $2.42 | -0.4% | +38.5% |
| 9 | Florida-So Georgia | $2.36 | -0.0% | +34.4% |
| 10 | Lower Mountain | $1.84 | -0.1% | +25.3% |
The top 10 origins carried 87.4% of all U.S. outbound loads moved in the week. Lower Midwest held up best week over week, up 4.2%, while several southern origins — Southeast, Carolinas, South Central and Florida-So Georgia — slipped on the week.
Market conditions

Flatbed freight pulled back as capacity rebuilt. Load posts fell 7.3% week over week, though they stand 46.2% above last year, and truck posts added 4.1% on the week while remaining 11.0% below a year ago. The load-to-truck ratio loosened to 36.44 from 40.92 a week earlier, still far above the 22.18 of a year ago.
New farm equipment is core open-deck freight — tractors and combines move from the ag-manufacturing belt to dealers on flatbeds, step-decks and RGNs — and the latest numbers point to a thinner load base ahead. U.S. sales of agricultural tractors fell 10.9% in July versus a year earlier, combine sales fell 5.3%, and July tractor sales ran 29% below the five-year average, pointing to a structural pullback rather than seasonal cooling. The decline is steepest in the high-horsepower segment behind the heaviest open-deck moves, with 4WD tractor sales down 38.7% year over year and 27.0% year to date. Association of Equipment Manufacturers vice president Curt Blades pointed to persistent economic uncertainty pushing farmers to defer equipment purchases, a dynamic that argues for a softer-than-seasonal flatbed and step-deck outlook into the back half of the year.
Short-term outlook

The 35-day DAT Rate Forecast puts flatbed spot linehaul at $2.63 per mile in mid-October, within an uncertainty band of about plus or minus $0.07 per mile (2.6% of the forecast point). Across equipment, the flatbed band ranks in the middle. That end-of-forecast rate stands about $0.57 per mile above the actual rate near the same date a year earlier ($2.06 per mile).