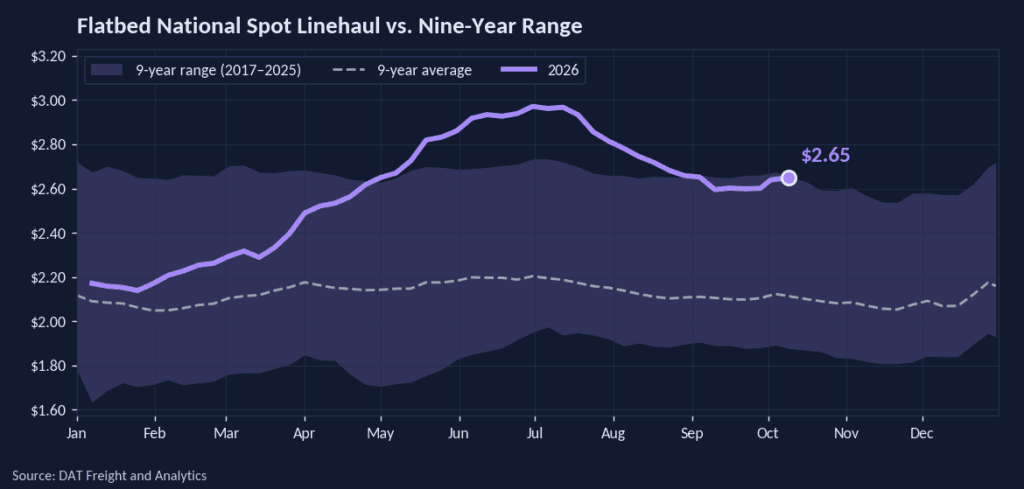
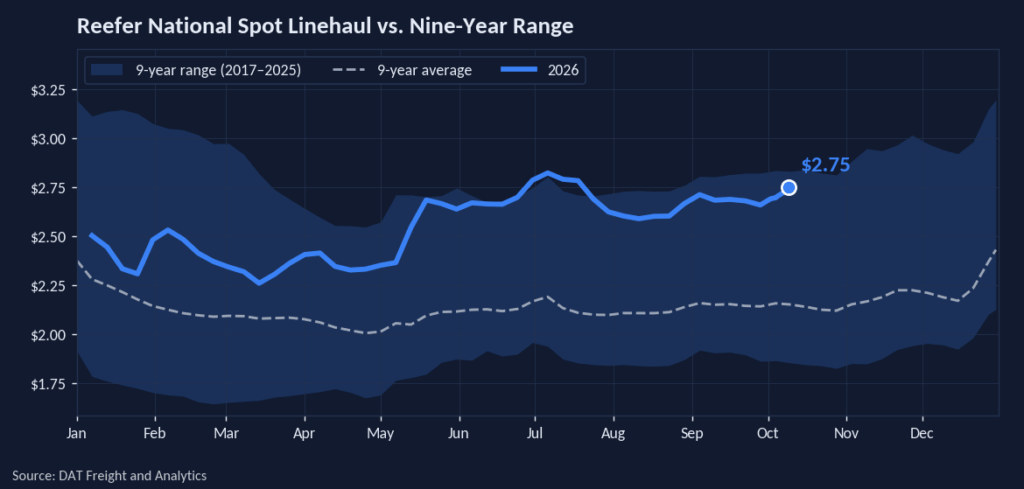
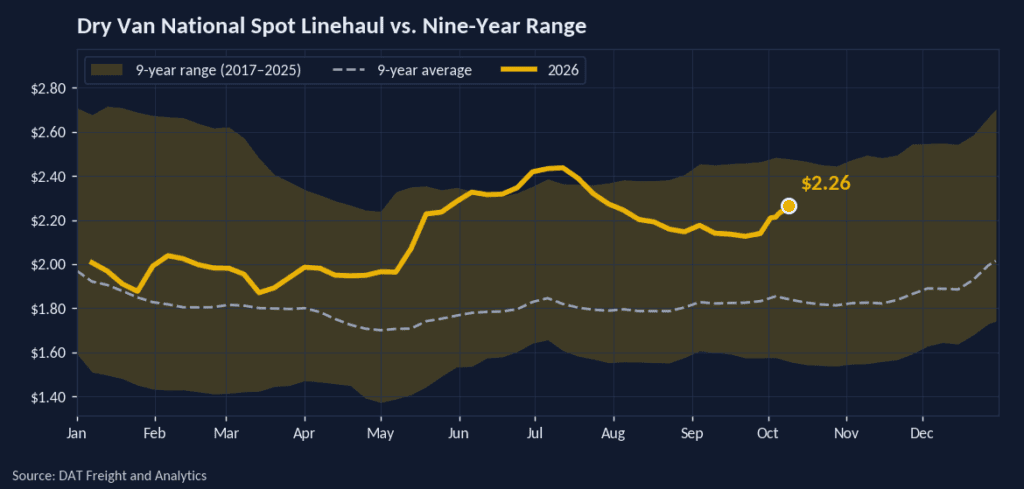
Dry van spot linehaul rates paid to carriers averaged $2.21 per mile this week, minus fuel, up 1.1%, or $0.02 per mile, from the prior week. Rates climbed 33.6%, or $0.55 per mile, year over year and held 21.4%, or $0.39 per mile, above the nine-year seasonal average of $1.82 per mile, near the top of the historical range.
All rates cited are linehaul only. They exclude fuel costs and surcharges unless otherwise noted.
Get the clearest, most accurate view of the truckload marketplace with data from DAT iQ.
Tune into DAT iQ Live, live on YouTube or LinkedIn, 10am ET every Tuesday.
Bellwether states
The 10 dry van bellwether states posted a moves-weighted outbound rate of $2.91 per mile this week, up 1.1%, or $0.03 per mile, week over week and up 36.9%, or $0.79 per mile, year over year. The roster carried 35.7% of all U.S. state-outbound dry van loads, in line with its recent baseline near 35%.
Regional rate trends
| Dry Van — Top 10 Origins by Rate Per Mile · Week Ending September 4, 2026 | ||||
|---|---|---|---|---|
| Rank | Origin Region | Avg RPM | WoW % | YoY % |
| 1 | Ohio River | $2.67 | +2.5% | +40.7% |
| 2 | Great Lakes | $2.67 | +3.4% | +38.1% |
| 3 | California | $2.51 | +0.5% | +30.5% |
| 4 | Upper Atlantic | $2.37 | +2.3% | +40.7% |
| 5 | Lower Midwest | $2.36 | +1.6% | +32.7% |
| 6 | Lower Atlantic | $2.34 | +1.2% | +39.3% |
| 7 | Southeast | $2.29 | +0.7% | +37.1% |
| 8 | Carolinas | $2.26 | +0.8% | +36.1% |
| 9 | South Central | $2.08 | +0.4% | +28.0% |
| 10 | Florida-So Georgia | $1.51 | +1.3% | +31.6% |
The top 10 origins carried 87.8% of all U.S. outbound loads moved in the week. Great Lakes held up best week over week, up 3.4%, with rates firming across nearly every leading origin as the market steadied after the month-end push.
Market conditions

Dry van demand held roughly steady while capacity edged back into the market. Load posts slipped 0.9% week over week but remain 42.2% above last year, and truck posts rose 1.4% on the week while sitting 17.2% below a year ago. With trucks returning faster than freight, the load-to-truck ratio eased to 11.47 from 11.73 a week earlier, still well above the 6.68 of a year ago.
The latest ISM manufacturing survey suggests freight is shifting rather than disappearing. A transportation-equipment panelist described volume as steady but flagged a customer relocating production from U.S. plants to Mexico, and a machinery respondent said they have pushed more sourcing offshore to offset costs — a nearshoring shift that pulls volume onto cross-border lanes like the Laredo gateway and reshapes domestic linehaul more than it adds to it. Electronics and miscellaneous-manufacturing respondents also point to an AI-driven supply scramble, with semiconductors, connectors, and government orders expanding and lead times the tightest since the post-COVID stretch, generating high-value freight tied to data-center buildout even as other corners of manufacturing cool. Several panelists linked rising input costs to a risk that consumer purchasing power softens, which is worth watching given how much of dry van demand rides on consumer-goods replenishment.
Short-term outlook

The 35-day DAT Rate Forecast puts dry van spot linehaul at $2.20 per mile in mid-October, within an uncertainty band of about plus or minus $0.08 per mile (3.5% of the forecast point). Across equipment, the dry van band ranks widest. That end-of-forecast rate stands about $0.53 per mile above the actual rate near the same date a year earlier ($1.68 per mile).