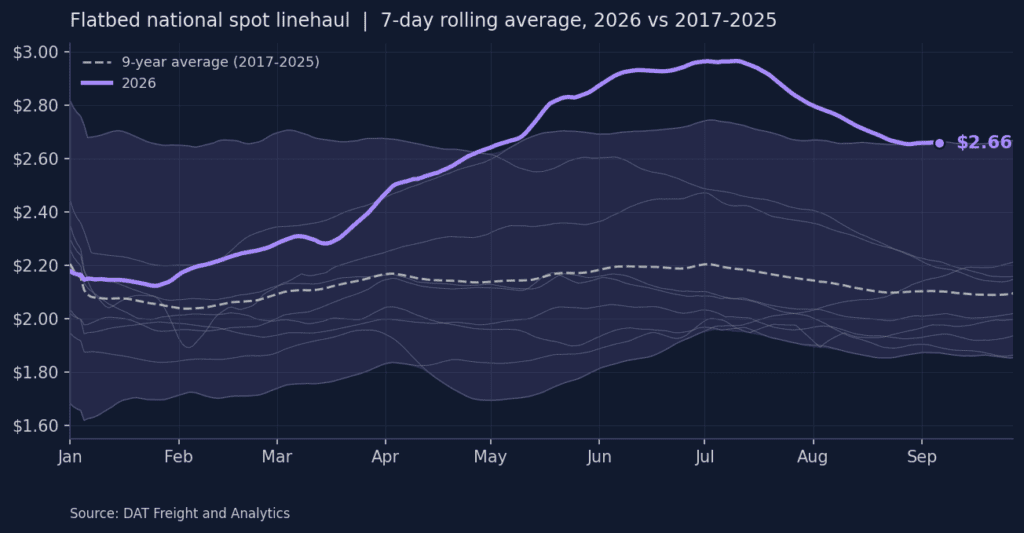
Flatbed spot linehaul rates paid to carriers averaged $2.62 per mile last week, minus fuel, down 1.8%, or $0.05 per mile, from the week before. Rates ran 29.8%, or $0.60 per mile, year over year and held 24.3%, or $0.51 per mile, above the nine-year seasonal average of $2.09 per mile, near the top of the historical range.
All rates cited are linehaul only. They exclude fuel costs and surcharges unless otherwise noted.
Get the clearest, most accurate view of the truckload marketplace with data from DAT iQ.
Tune into DAT iQ Live, live on YouTube or LinkedIn, 10am ET every Tuesday.
Bellwether states
The 10 flatbed bellwether states posted a moves-weighted outbound rate of $3.17 per mile last week, down 4.1%, or $0.13 per mile week over week and up 26.3%, or $0.66 per mile, year over year. The roster carried 51.9% of all U.S. state-outbound flatbed loads, within its 51 to 53% baseline.
Regional rate trends
| Flatbed — Top 10 Origins by Rate Per Mile · Week Ending September 11, 2026 | ||||
|---|---|---|---|---|
| Rank | Origin Region | Avg RPM | WoW % | YoY % |
| 1 | Ohio River | $3.05 | -3.6% | +36.2% |
| 2 | Southeast | $2.94 | -4.5% | +30.9% |
| 3 | Carolinas | $2.86 | -1.4% | +35.8% |
| 4 | Great Lakes | $2.74 | -2.5% | +32.5% |
| 5 | Upper Atlantic | $2.51 | +0.1% | +29.7% |
| 6 | Lower Midwest | $2.48 | -3.6% | +25.9% |
| 7 | South Central | $2.37 | -5.1% | +24.0% |
| 8 | California | $2.23 | -7.7% | +29.7% |
| 9 | Florida-So Georgia | $2.22 | -6.2% | +31.3% |
| 10 | Lower Mountain | $1.73 | -6.1% | +16.9% |
The top 10 origins carried 87.5% of all U.S. outbound loads moved in the week. Upper Atlantic led week over week at +0.1%, as several southern origins softened over the short week.
Market conditions

Flatbed ran against the grain last week, tightening even as overall volume thinned for the holiday. Truck posts fell 16.3% week over week, outpacing an 11.6% decline in load posts, so capacity left the market faster than freight. Load posts remain 11.0% above last year and truck posts sit 38.6% below. That squeeze lifted the load-to-truck ratio to 38.47 from 36.44 the week before last, far above the 21.29 of a year ago.
Short-term outlook

The 35-day DAT Rate Forecast puts flatbed spot linehaul at $2.59 per mile in mid-October, within an uncertainty band of about plus or minus $0.06 per mile (2.2% of the forecast point). Across equipment, the flatbed band ranks narrowest. That end-of-forecast rate stands about $0.54 per mile above the actual rate near the same date a year earlier ($2.05 per mile).
Freight demand outlook
New farm equipment is core open-deck freight, tractors and combines roll off assembly lines in the ag-manufacturing belt and move to dealers on flatbeds, step-decks, and RGNs, so the July numbers from the Association of Equipment Manufacturers point to a thinner load base for open-deck carriers. U.S. sales of agricultural tractors fell 10.9% in July 2026 versus a year earlier, while combine sales declined 5.3%. More telling for the demand trend, July total farm tractor sales came in 29% below the five-year average, underscoring that this is a structural downshift rather than ordinary seasonal cooling. The weakness runs deeper in the high-horsepower segment that generates the heaviest, most permit-intensive open-deck moves: 4WD farm tractor sales dropped 38.7% year over year in July and are down 27.0% year-to-date. Canadian tractor sales were off 7.8% and combines down 10.8% in the same month, so the pullback isn’t confined to one side of the border. Year-to-date, U.S. tractor units are down 13.1% and combines 10.2%, a sustained decline in manufacturing-origin freight rather than a one-month blip.
The bigger signal for open-deck operators is the demand backdrop behind those numbers. Curt Blades characterized the July data as continued softness in the agricultural equipment market, with farmers navigating persistent economic uncertainty and making difficult decisions on whether to invest. When producers defer equipment purchases, the effect compounds across the open-deck network: fewer new machines leaving the plants, fewer trade-ins cycling to secondary markets, and softer farm capital spending on the building materials, steel, and implements that round out flatbed lanes through the Midwest and Plains. For carriers and brokers, that argues for a softer-than-seasonal flatbed and step-deck outlook into the back half of 2026, with pricing leverage staying on the shipper side of the table until equipment demand, and the freight it generates, finds a floor.
Weekly reports
- Dry van
- Reefer – pending, held until produce/demand narrative is added
- Flatbed (this report)