National refrigerated produce volume fell 3% last week and 7% from a year earlier. Mexico crossings through Texas fell 9% and South and Central California fell 25%, while the Imperial and Coachella section jumped 33%. California and Washington each slipped 1%. The rates in this report are USDA open-market (spot) rates that shippers or receivers pay per load, including brokers’ fees, and they ran 16% to 51% above last year.
Rate and volume figures come from USDA and cover produce-only refrigerated freight near 34 degrees. Rates are per load and exclude extra charges for terminal-market delivery, multi-pickup, and multi-drop shipments unless otherwise noted.
Get the clearest, most accurate view of the truckload marketplace with data from DAT iQ.
Tune in to DAT Market Update, Mondays at 11am Eastern.
Rates and volume
Produce truck rates are holding well above last year while volume slips again. Across the lanes USDA publishes for California, Texas, and Washington, average rates sit 16% to 51% above last year: Washington leads at 51%, California is up 39%, and Texas is up 16%. Week over week, Santa Maria into Miami leads at 10%, Imperial and Coachella into Baltimore and Philadelphia rose 9%, and Oxnard into Baltimore and South and Central California vegetables into Chicago each rose 8%. National volume, summed across every origin in the export, fell 3% from the week before and is down 7% from a year earlier. Texas fell 9% on limes, cucumbers, and avocados, California slipped 1% and is down 14% from a year earlier, and Washington held within 1% of the week before. Inside California, in-state district volume fell 6%, and growers report some farmworkers staying home amid immigration enforcement. The data does not show enforcement as the cause.
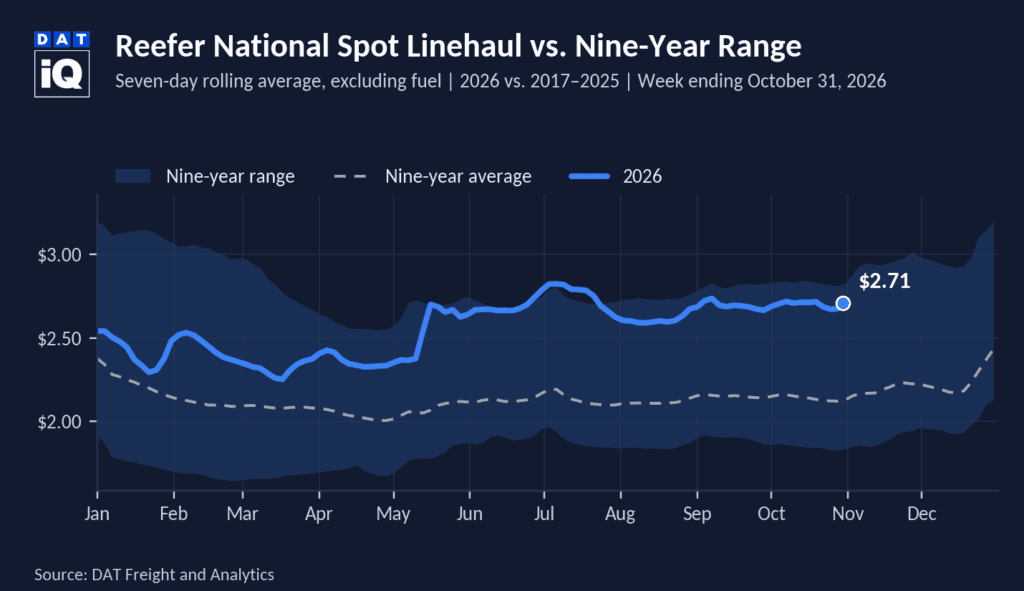
Rates running this far above last year while volume slips is consistent with a tighter market, though lane moves were uneven: South and Central California vegetables into New York fell 9% and South Texas into Miami fell 7%. According to USDA, produce spot rates averaged $3.83 per mile for the week ending November 3, and truck availability averaged 3, or adequate, on USDA’s 1-to-5 scale. Of the 48 lanes published in both years, that average is up 40% from a year earlier, or $1.08 per mile, and 16 of the 76 lanes read 4, a slight shortage. RateView shows reefer spot linehaul rates paid to carriers averaging $2.71 per mile, minus fuel, for the week ending October 31, up 31.2% from a year earlier, or $0.65 per mile, and up 1.2% from the week before.
State scorecard
Reefer produce state scorecard for the week ending November 3, 2026. Volume and average rate are shown week over week (WoW) and year over year (YoY).
| Reefer Produce State Scorecard · Week Ending November 3, 2026 | ||||
|---|---|---|---|---|
| State | Volume WoW | Volume YoY | Avg rate WoW | Avg rate YoY |
| California | -1% | -14% | +2% | +39% |
| Texas | -9% | -6% | -2% | +16% |
| Washington | -1% | +4% | +1% | +51% |
| North Carolina | -14% | +55% | n/a | n/a |
| Delmarva | -41% | +3,655% | n/a | n/a |
States are ranked by total weekly volume. Rate figures are simple averages of each state’s lane movements. The n/a entries mean no rate lanes were reported.
California
California volume slipped 1% and fell 14% from a year earlier.
Kern. Volume fell 4% and rose 5% from a year earlier. Grapes make up 90% of the section and fell 6%, while potatoes rose 16% and 45% from a year earlier. USDA now reports Kern grapes under the combined “San Joaquin Valley and Kern District” label, so this section combines the two labels to keep year-over-year comparisons consistent. Rates out of Kern rose 2% on average and are 47% above last year, led by Baltimore at 5%. Last year’s Kern lanes carried a different basket, so the year-over-year comparisons match on origin district and destination city only.
Oxnard. Volume rose 38% but sits 50% below last year. Strawberries, 57% of the section, rose 65% and are down 64% from a year earlier. Romaine rose 30%, artichokes rose 39%, and celery rose 23%. Iceberg lettuce had no volume the week before last. Inference: the strawberry gain looks like a rebound after the 49% drop the week before last, though volume remains well under last year. Rates rose 7% on average and sit 47% above last year. Baltimore gained 8% and Philadelphia gained 6%. The basket includes strawberries, which last year’s did not.
Salinas-Watsonville. Volume fell 6% and 14% from a year earlier. Celery, the largest item at 37% of the section, rose 8%, while romaine fell 30%, iceberg fell 25%, and cauliflower fell 15%. Sweet corn had no volume last week. Inference: the lettuce declines fit the usual fall tapering in the district, but the export does not label the cause. Rates rose 1% on average and sit 36% above last year. Philadelphia gained 6% and Baltimore gained 5%, while New York and Chicago each fell 3%. Chicago shows the smallest gain from a year earlier, at 15%.
Santa Maria. Volume fell 3% and rose 43% from a year earlier. Celery (18% of the section) rose 30% and is up 307% from a year earlier, and strawberries rose 32%. Iceberg lettuce fell 14%, romaine fell 36%, broccoli fell 8%, and cauliflower fell 35%. Sugar snap peas and kale greens had no volume last week. Rates rose 3% on average and sit 48% above last year. Miami gained 10%, Philadelphia gained 8%, and Dallas gained 5%, while Chicago fell 2% and Boston fell 1%.
South and Central California. Volume fell 25% and 35% from a year earlier. Iceberg lettuce (46% of the section) rose 3% and romaine rose 19%, but tomatoes fell 85%, cantaloupes fell 48%, and bell peppers fell 10%. Peaches, celery, and watermelons had no volume last week, while sweet corn rose 466%. Inference: the melon and peach drops fit the end of the summer season. Rates rose 1% on average and sit 41% above last year, but the lanes split. Vegetable lanes into Chicago rose 8% and citrus into Atlanta rose 7%, while vegetables into New York fell 9% and citrus into Seattle and Miami fell 9% and 8%. Vegetable lanes compare with last year’s citrus-basket lanes from the same origin to the same city.
Imperial and Coachella Valleys, Arizona, and Mexico crossings
Volume through the section rose 33% and fell 13% from a year earlier. The Arizona crossings (Nogales, Douglas, and Lukeville) rose 36% and slipped 4% from a year earlier. The Calexico and San Luis crossings slipped 3% and fell 10% from a year earlier. The Imperial, Coachella, and Palo Verde districts jumped 159% but remain 54% below last year, and the Arizona region rose 40% and fell 28% from a year earlier. Watermelons (up 74%), bell peppers (up 140%), romaine (up 256%), and cucumbers (up 20%) led the gains, while cantaloupes fell 26% and 58% from a year earlier. Oranges, jackfruit, rambutan, dill, and blueberries had no volume the week before last, and choy sum had none last week. Inference: the jump in the desert districts looks like the winter vegetable season getting a late start against last year.
Rates on the Imperial and Coachella lanes rose 4% on average, with eight of nine lanes up and Miami flat. Nogales crossings published a second report with no printed week-over-week change. Against last year’s Nogales lanes they run 15% to 42% higher, and last week’s basket added cantaloupes back, matching last year’s.
Mexico crossings through Texas
Volume through the Mexico-Texas crossings fell 9% and 6% from a year earlier. Avocados (25% of the section) fell 6%, limes fell 19%, cucumbers fell 35%, and bell peppers fell 13%, while watermelons rose 20%. Lotus root, yu choy, bitter melon, artichokes, and gandules had no volume the week before last. Rates slipped 2% on average and sit 16% above last year. Chicago rose 5%, Atlanta and Dallas were flat, and Miami fell 7%, with New York and Philadelphia down 4%. Miami (24% above) and Philadelphia (20% above) show the biggest gaps to last year. Boston and New York had no lanes a year ago.
Washington
Volume in the Yakima Valley, Wenatchee, and Columbia Basin fell 1% and rose 4% from a year earlier. Apples, 58% of the section, slipped 1% and fell 1% from a year earlier. Pears fell 6% and 13% from a year earlier, dry onions rose 1% and 20%, and potatoes rose 4% and 22%. Rates out of Yakima and Wenatchee rose 1% on average and sit 51% above last year. Los Angeles gained 7% and Philadelphia gained 6%, while Seattle fell 7%, Atlanta and New York each fell 3%, and Dallas fell 2%. Chicago (70% above) and Dallas (64% above) show the biggest gaps to last year.
North Carolina and Delmarva
North Carolina volume fell 14% and rose 55% from a year earlier. Sweet potatoes make up essentially the whole section and fell 14%. Delmarva volume fell 41% and rose 3,655% from a year earlier, off a very small base. Tomatoes are essentially the whole section and fell 19%, and watermelons had no volume last week. USDA published no rate lanes for either state last week or a year ago, so the scorecard shows n/a.
What this means for carriers, shippers, and brokers
Carriers: Favor the desert and the coast. Imperial and Coachella vegetables into Baltimore and Philadelphia rose 9%, Santa Maria into Miami rose 10%, and Imperial and Coachella volume rose 33%. In Washington, Yakima into Los Angeles rose 7% and into Philadelphia rose 6%, while Yakima into Seattle fell 7%. Texas is the soft spot: volume fell 9%, lane rates slipped 2% on average, and Miami (down 7%), New York (down 4%), and Philadelphia (down 4%) gave back the most. These are USDA lane rates per load, not carrier earnings. Inference: with South and Central California volume down 25%, expect fewer loads there and more competition for the desert lanes. Takeaway: point trucks at Baltimore and Philadelphia out of the desert, and do not count on last week’s South Texas rates to the Northeast holding.
Shippers: Budget for rates well above last year. Average lane rates are 39% above last year in California, 51% above in Washington, and 16% above in Texas, before any further weekly moves. Softening is limited and lane specific: South and Central vegetables into New York (down 9%), citrus into Seattle (down 9%) and Miami (down 8%), and Yakima into Seattle (down 7%). Flexibility on the receiving point pays: from South and Central vegetables, Philadelphia runs about 6% below New York at the midpoints, and from Kern about 12% below. South and Central vegetables into Chicago rose 8% and sit 74% above last year while the section’s volume fell 25%, so cover Chicago early. Inference: lower volume with rising rates on that lane looks like supply tightening, and it could carry forward. Takeaway: lock in Chicago and Baltimore lanes out of California early, and shift receivers to Philadelphia where you can.
Brokers: Margin pressure is uneven, so price lane by lane. Imperial and Coachella into Baltimore and Philadelphia (up 9%), Oxnard into Baltimore (up 8%), and South and Central vegetables into Chicago (up 8%) are costing more to cover, while South and Central vegetables into New York (down 9%) and South Texas into Miami (down 7%) are costing less, which creates room to hold the customer rate. Texas lane rates averaged 2% lower on 9% less volume, so those loads should cover without a premium. Inference: with South and Central volume down 25%, carriers have less reason to discount Chicago, so quotes there should stay high. Takeaway: lock capacity on the lanes that rose, and keep your customer rate steady where the carrier rate fell.
About these rates
Rates are for Tuesday, November 3, 2026. Week-over-week changes are USDA’s printed changes from Tuesday, October 27, 2026. Year-over-year changes compare the midpoint of each lane’s mostly range with the same origin district and destination city in the USDA report for Tuesday, November 4, 2025. Rates are open (spot) market sales that shippers or receivers pay, depending on the basis of sale, per load, including brokers’ fees, for truckload shipments to a single destination in 48-53 foot refrigerated trailers from the origin shipping area to the destination receiving city. The ten destination cities are Atlanta, Baltimore, Boston, Chicago, Dallas, Los Angeles, Miami, New York, Philadelphia, and Seattle. The national average rate per mile divides the midpoint of each lane’s USDA mostly range by lane distance, weighted by miles, and includes broker fees. USDA’s truck availability rating runs from 1 to 5: 1 is surplus, 2 is slight surplus, 3 is adequate, 4 is slight shortage, and 5 is shortage.
Volumes are USDA AMS AgTransport reported refrigerated truck movement of fresh fruits and vegetables, and the report shows only percentage changes. Volume comparisons use the same weeks, based on the Tuesday week ending dates of November 3, 2026, October 27, 2026, and November 4, 2025. State volume is the sum of the origin districts and crossings in each section, and USDA revises volume data, so prior-week figures can differ slightly from earlier reports.