Reefer spot linehaul rates paid to carriers averaged $2.71 per mile last week, minus fuel, up 1.2%, or $0.03 per mile, from the week before. Rates climbed 31.2%, or $0.65 per mile, year over year and held 27.5%, or $0.58 per mile, above the nine-year seasonal average of $2.13 per mile, near the top of the historical range.
All rates cited are linehaul only. They exclude fuel costs and surcharges unless otherwise noted.

Get the clearest, most accurate view of the truckload marketplace with data from DAT iQ.
Tune in to DAT Market Update, Mondays at 11am Eastern.
Bellwether states
The reefer bellwether states averaged $3.56 per mile, down $0.06 week over week and up $0.87, or 32.5%, year over year. The ten states held 41.5% of national reefer outbound volume.
Regional rate trends
| Reefer — Top 10 Origins by Share of Outbound Loads · Week Ending October 31, 2026 | ||||
|---|---|---|---|---|
| Rank | Origin Region | Avg RPM | WoW | YoY |
| 1 | Great Lakes | $3.27 | −$0.05 | +$0.79 |
| 2 | South Central | $2.15 | $0.00 | +$0.29 |
| 3 | Upper Atlantic | $2.69 | −$0.03 | +$0.71 |
| 4 | California | $2.77 | +$0.04 | +$0.66 |
| 5 | Southeast | $2.34 | −$0.07 | +$0.41 |
| 6 | Lower Mountain | $2.38 | +$0.03 | +$0.40 |
| 7 | Ohio River | $3.11 | −$0.14 | +$0.70 |
| 8 | Upper Midwest | $3.43 | −$0.17 | +$0.74 |
| 9 | Lower Midwest | $3.10 | −$0.05 | +$0.58 |
| 10 | Florida-So Georgia | $1.39 | −$0.05 | +$0.13 |
The top 10 origin regions accounted for 84.0% of outbound reefer loads last week. California held up best week over week, up $0.04 per mile to $2.77, followed by Lower Mountain, up $0.03. Upper Midwest gave back the most, down $0.17.
Market conditions
The reefer load-to-truck ratio firmed to 15.73 from 14.79 as load posts rose 1.8% and truck posts fell 4.3%. Load posts are now 11.3% above a year ago, and the ratio sits 42.8% above the 11.02 recorded in the same week last year.
Produce report
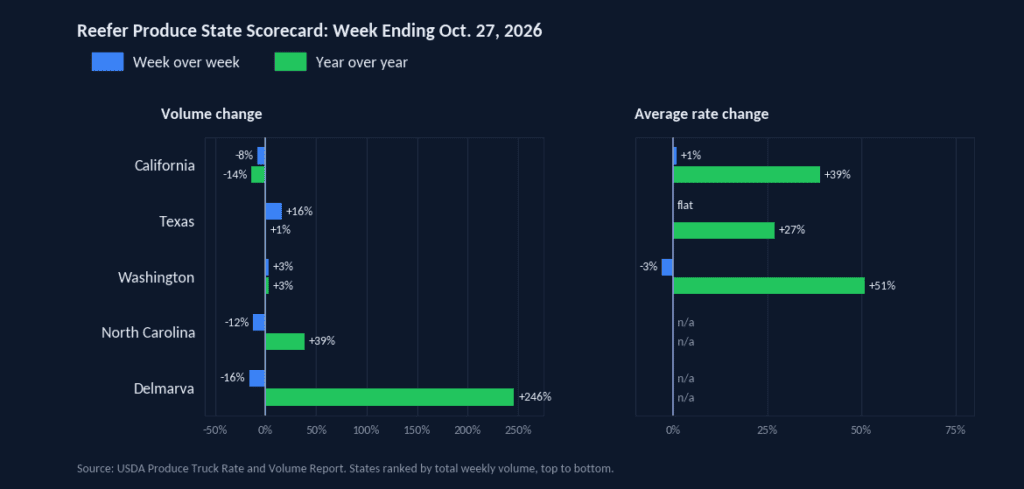
Produce truck rates are climbing year over year while volume slips. Across the lanes USDA reports, Washington averages 51% above last year, California 41%, and Texas 27%. State figures are simple averages of lane movements. National volume rose 3% week over week but sits 6% below the same week last year. Texas drove the weekly gain, up 16% week over week, while California fell 8% week over week and 14% year over year. Desert lettuce roughly doubled week over week as coastal lettuce fell 28%. Read the detailed produce report on the DAT blog.
Short-term outlook

The DAT Rate Forecast projects reefer spot linehaul will edge up to $2.73 per mile 35 days out, against $2.71 last week. The Forecast Low is $2.64 and the Forecast High is $2.82, a spread of $0.18, the widest of the three equipment types. A year ago the market sat near $2.16 per mile, so the projected level holds well above it. Thanksgiving falls inside the forecast window, and the holiday brings seasonal demand for turkeys, produce, dairy, and other perishables, so reefer loads typically pull forward into the week before the holiday.