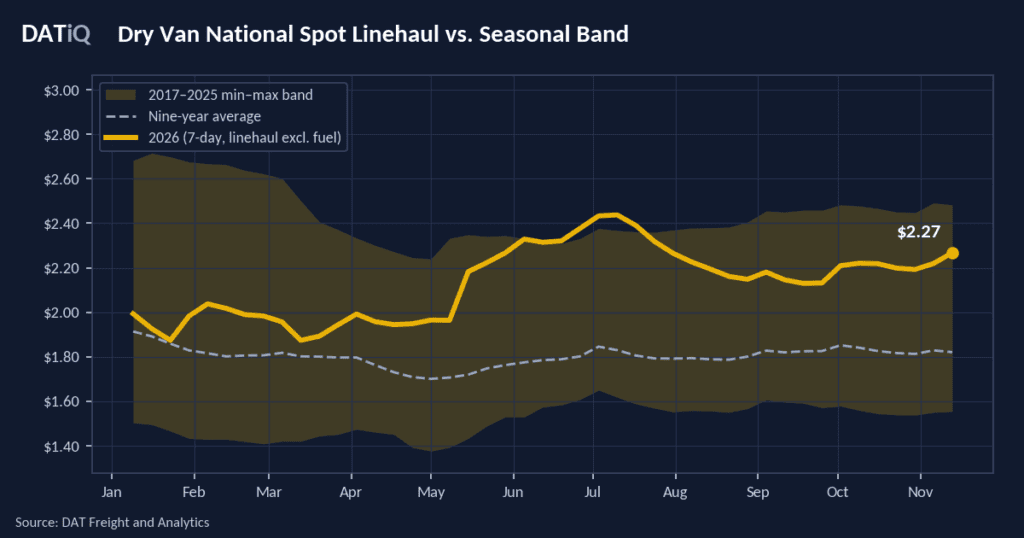
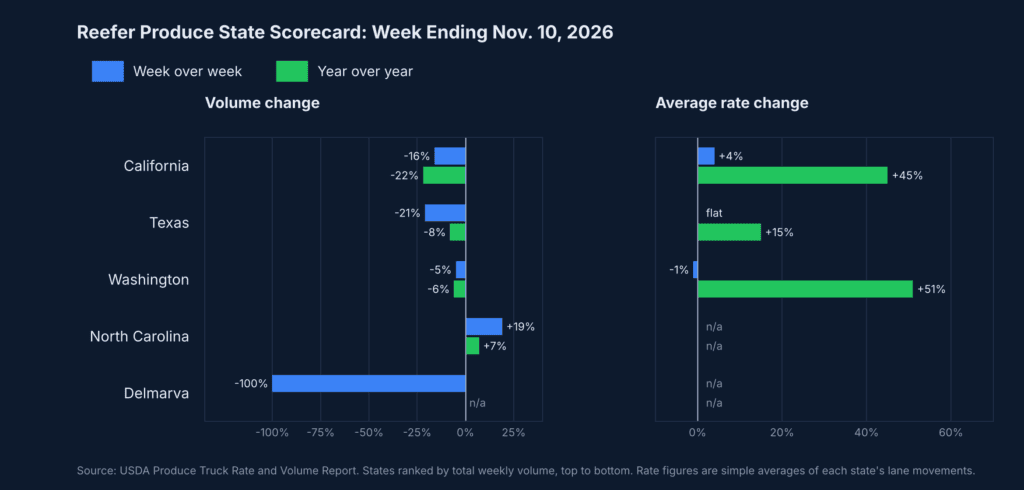
Flatbed spot linehaul rates paid to carriers averaged $2.60 per mile last week, minus fuel, down 0.3%, or $0.01 per mile, from the week before. Rates climbed 31.4%, or $0.62 per mile, year over year and held 26.6%, or $0.55 per mile, above the nine-year seasonal average of $2.05 per mile, near the top of the historical range.
All rates cited are linehaul only. They exclude fuel costs and surcharges unless otherwise noted.

Get the clearest, most accurate view of the truckload marketplace with data from DAT iQ.
Tune in to DAT Market Update, Mondays at 11am Eastern.
Bellwether states
Flatbed’s ten bellwether states (TX, GA, PA, AL, OK, IL, TN, SC, AR, and CA) averaged $3.11 per mile last week, down $0.05 per mile, or 1.6%, from the week before and up $0.68 per mile, or 28.1%, year over year. They carry 52.2% of flatbed moves, the largest share of the three equipment types.
Regional rate trends
| Flatbed — Top 10 Origins by Rate Per Mile · Week Ending November 13, 2026 | ||||
|---|---|---|---|---|
| Rank | Origin Region | Avg RPM | WoW $ | YoY $ |
| 1 | South Central | $2.23 | +$0.01 | +$0.38 |
| 2 | Great Lakes | $2.87 | −$0.01 | +$0.79 |
| 3 | Southeast | $2.87 | +$0.01 | +$0.72 |
| 4 | Upper Atlantic | $2.53 | −$0.04 | +$0.65 |
| 5 | Ohio River | $3.13 | +$0.03 | +$0.89 |
| 6 | Carolinas | $2.73 | −$0.08 | +$0.70 |
| 7 | Florida-So Georgia | $2.14 | −$0.10 | +$0.47 |
| 8 | California | $2.34 | +$0.05 | +$0.68 |
| 9 | Lower Mountain | $1.82 | −$0.01 | +$0.37 |
| 10 | Lower Atlantic | $2.93 | +$0.03 | +$0.91 |
The top 10 origins carry 88.0% of flatbed loads. South Central dominates with 24.5% of loads, but at $2.23 per mile it has the third-lowest rate in the group, up $0.01 per mile from the week before. California held up best week over week, rising $0.05 per mile, or 2.1%, to $2.34 per mile. Ohio River posted the highest rate at $3.13 per mile, up $0.03 per mile, or 0.9%. Florida-So Georgia fell $0.10 per mile, or 4.5%, to $2.14 per mile, and Carolinas fell $0.08 per mile, or 2.9%, to $2.73 per mile.
Market conditions
Flatbed’s load-to-truck ratio dropped to 33.34 last week from 42.26 the week before and sat at 17.66 a year ago. Load posts fell 11.3% and truck posts rose 12.5% from the week before, so the ratio loosened from both directions. Year over year, load posts are up 47.7% and truck posts are down 21.8%. Rates also track 2021 closely. Flatbed ran $0.05 per mile, or 2.1%, above the same week of 2021, and the eight-week averages match at $2.62 per mile. The year-over-year gain leans on a soft 2025 comparison.
Short-term outlook

The DAT Rate Forecast projects flatbed spot linehaul will rise to $2.64 per mile 35 days out, against $2.60 per mile last week. The Forecast Low is $2.57 per mile and the Forecast High is $2.70 per mile, a spread of $0.13 per mile, the narrowest of the three equipment types. A year ago the market sat near $2.11 per mile, so the projected level stays well above it. Flatbed historically sits below trend through mid-December and gets little holiday lift, as construction and industrial shippers wind projects down toward year-end.