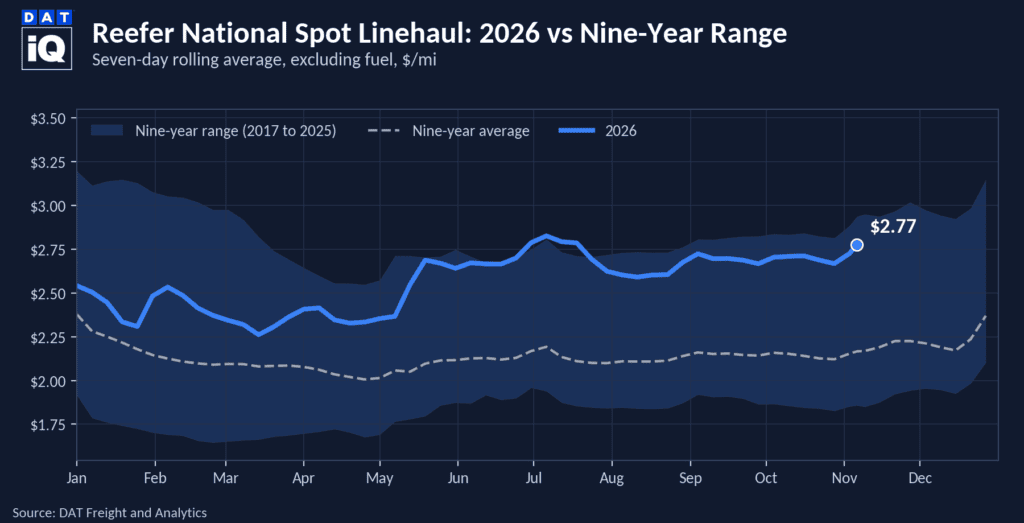
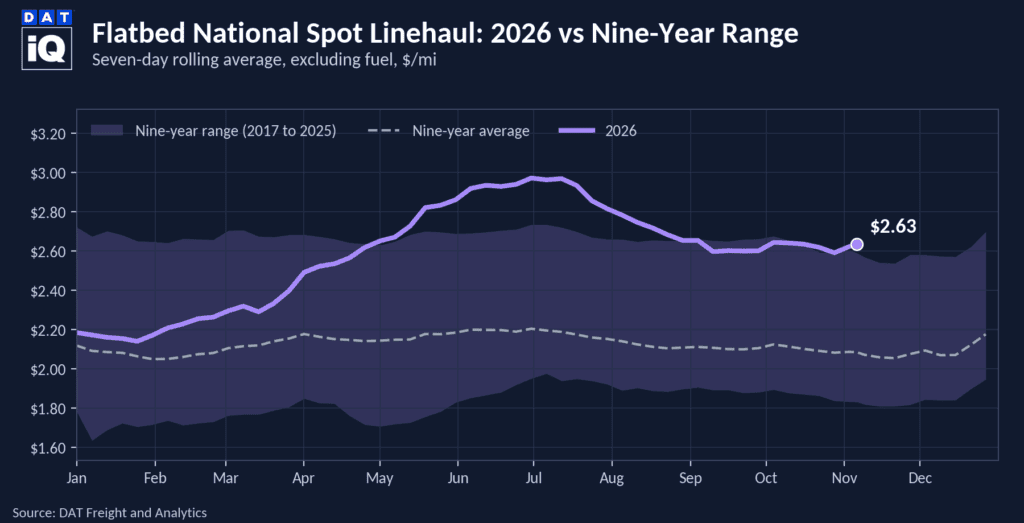
National refrigerated produce volume fell 17% week over week and is down 17% year over year, according to USDA data for the week ending Nov. 10. Rates did not follow it down. Reefer spot linehaul rates paid to carriers averaged $2.77 per mile last week, minus fuel, up 3.3% from the week before and up 34.0%, or $0.70 per mile, year over year, according to DAT RateView data for the week ending Nov. 6.
All rates cited are linehaul only. They exclude fuel costs and surcharges unless otherwise noted.
Get the clearest, most accurate view of the truckload marketplace with data from DAT iQ.
Tune in to DAT Market Update, Mondays at 11am Eastern.
The big picture
By state, Texas fell 21% on avocados, tomatoes, and watermelons, California fell 16%, and Washington slipped 5%. Lane rates sit well above last year in all three states: Washington is up 51% year over year, California is up 45%, and Texas is up 15%.
USDA reported produce spot rates averaging $3.94 per mile for the week ending Nov. 10, with truck availability at 3, or adequate, on its 1-to-5 scale. On the 48 lanes published in both years, that average is up 43%, or $1.16 per mile, year over year, and 16 of the 76 lanes read 4, slight shortage. USDA rates are per-load figures that include broker fees and cover refrigerated produce freight near 34 degrees. RateView covers all reefer freight, so the two are independent reads, and they point the same way.
The week’s rate leaders were Imperial and Coachella vegetables into Atlanta (+15% week over week), Oxnard into Philadelphia and Salinas-Watsonville into Chicago (+13% each), and Imperial and Coachella into Chicago (+12%). The moves were uneven. South and Central California citrus into New York fell 7%, and Imperial and Coachella vegetables into Baltimore fell 4%. Growers also continue to report some California farmworkers staying home amid immigration enforcement, and in-state district volume fell 20%.
State scorecard

States ranked by total weekly volume. Rate figures are simple averages of each state’s lane movements.
California: freight shifts to the desert
Lettuce arrived in Imperial and Coachella. Romaine rose 110% week over week and iceberg 195%, yet section volume still fell 12% (down 27% year over year) as watermelons, cucumbers, cantaloupes, and bell peppers faded. Rates on the nine lanes rose 6% on average, led by Atlanta (+15%), Chicago (+12%), and New York (+11%), while Baltimore (-4%) and Seattle (-3%) slipped. Inference: the lettuce jump looks like winter salad season moving into the desert, which would also explain the pullback in Salinas-Watsonville, where volume fell 30% as romaine dropped 63% and iceberg 76%. Chicago from Salinas-Watsonville is the odd lane, up 13% week over week and 31% year over year on a section that lost nearly a third of its loads.
Kern is the rate story of the week. Lanes rose 7% week over week and 57% year over year on average, with Chicago and Philadelphia each up 9% (up 62% and 52% year over year) and volume down 14%. Oxnard into Philadelphia jumped 13% and sits 62% above last year, on volume down 9% week over week and 46% year over year. Santa Maria volume fell 28% week over week but is 27% above last year, and rates rose 4% week over week and 56% year over year. South and Central California volume fell 9% week over week, and rates held flat but sit 44% above last year. Citrus into Dallas (+6%) and Miami (+4%) rose, while citrus into New York (-7%), Baltimore (-3%), and Chicago (-3%) fell.
Texas, Washington, and the rest
Texas posted the steepest drop among the three major states. Volume through the Mexico-Texas crossings fell 21% week over week and 8% year over year, led by watermelons (-57%), avocados (-39%), and tomatoes (-37%). Rates did not move on any of the nine lanes and sit 15% above last year, with Miami (+24%) and Philadelphia (+20%) showing the biggest gaps.
Washington held steadier. Volume fell 5% week over week and 6% year over year, with apples, 61% of the section, flat week over week. Rates slipped 1% but sit 51% above last year, with Miami (+66%), Dallas (+62%), and Chicago (+60%) showing the widest gaps. Chicago was the only lane to gain (+3%) and Philadelphia the biggest decliner (-4%).
North Carolina volume rose 19% week over week and 7% year over year, almost entirely sweet potatoes. Delmarva had no volume, down 100% week over week from a small tomato base. USDA published no rate lanes for either, so the rate columns show n/a.
What this means for carriers, brokers, and shippers
Carriers: The money is in the desert and on the Chicago and Philadelphia lanes out of California. These are USDA lane rates per load, not carrier earnings. Texas needs care: volume fell 21% and none of the nine South Texas lanes moved, so there is no rate cushion for the lost loads. Inference: with Salinas-Watsonville and Santa Maria volume down sharply as lettuce shifts to the desert, trucks that worked the coast should follow the freight, and that crowding could cap Imperial and Coachella gains within a week or two. Takeaway: point trucks at Imperial and Coachella into Atlanta and Chicago now, and do not plan around South Texas rates rising.
Brokers: Coverage costs moved in opposite directions on neighboring lanes, so one blended quote will lose money somewhere. Imperial and Coachella into Atlanta, Oxnard into Philadelphia, and Salinas-Watsonville into Chicago cost more to cover than the week before. South and Central citrus into New York, Imperial and Coachella into Baltimore, and Yakima into Philadelphia cost less, which leaves room to hold the customer rate. Texas rates were flat on 21% less volume, so those loads should cover without a premium. Inference: Salinas-Watsonville into Chicago rose 13% on 30% less volume, which looks like supply tightening, and carriers there have little reason to discount. Takeaway: re-quote Chicago from Salinas-Watsonville and Kern before the next tender, and keep the Baltimore customer rate steady where the carrier rate fell.
Shippers: Budget for lane rates 45% above last year out of California, 51% above out of Washington, and 15% above out of Texas, and expect little relief. The softening that exists is lane specific: South and Central citrus into New York, Baltimore, and Chicago, Imperial and Coachella into Baltimore, and Yakima into Philadelphia. Flexibility on the receiving point saves real money. From Imperial and Coachella, Philadelphia runs about 11% below New York at the midpoints, from Santa Maria about 10% below, and from Kern about 9% below. Oxnard is the exception, with Philadelphia about 6% above Baltimore. Inference: Chicago from Salinas-Watsonville and Kern looks set to keep climbing while coastal volume stays thin. Takeaway: cover Chicago from Kern and Salinas-Watsonville early, and move Northeast receivers to Philadelphia wherever the product allows.
About the data
USDA rates are for Tuesday, Nov. 10, 2026. Week-over-week changes are USDA’s printed changes from Tuesday, Nov. 3, 2026, and year-over-year changes compare lane midpoints with the USDA report for Tuesday, Nov. 11, 2025. USDA rates are open-market spot sales that shippers or receivers pay, per load, including broker fees, for truckload shipments in 48- to 53-foot refrigerated trailers to ten destination cities. Volumes are USDA AMS AgTransport refrigerated truck movement of fresh fruits and vegetables. USDA revises volume data, so prior-week figures can differ slightly from earlier reports. Some year-over-year comparisons match on origin district and destination city only, because last year’s lane baskets differed. Nogales crossings published with no printed week-over-week change.