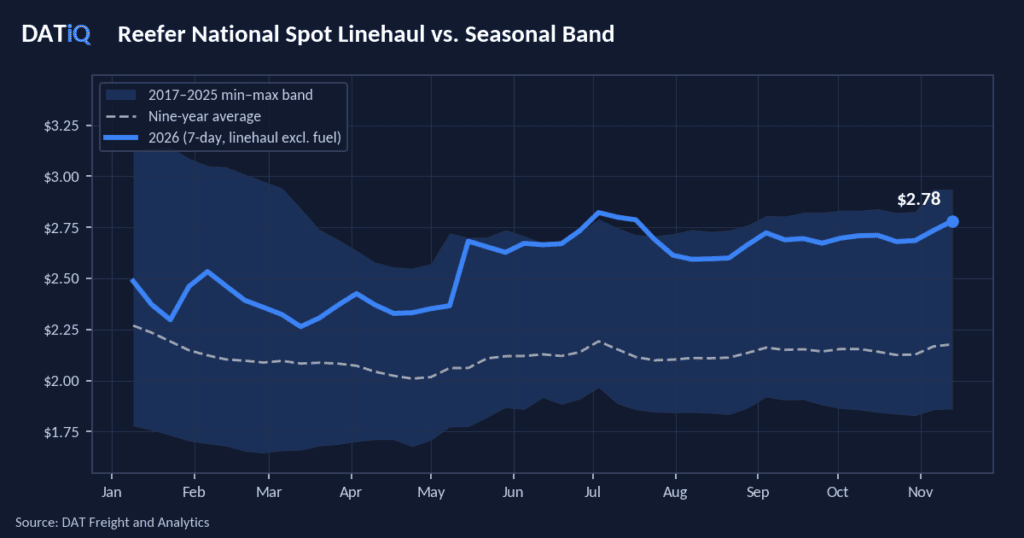
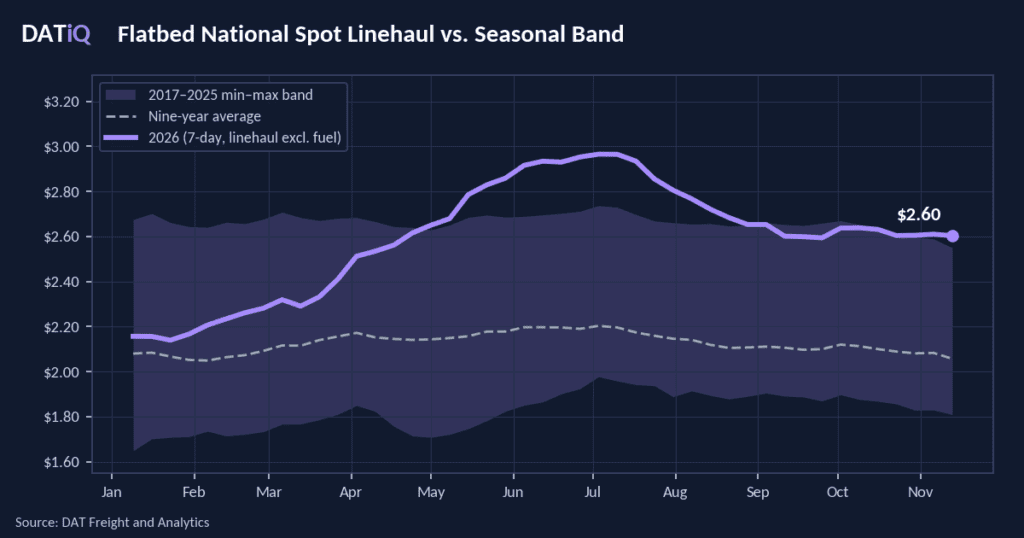
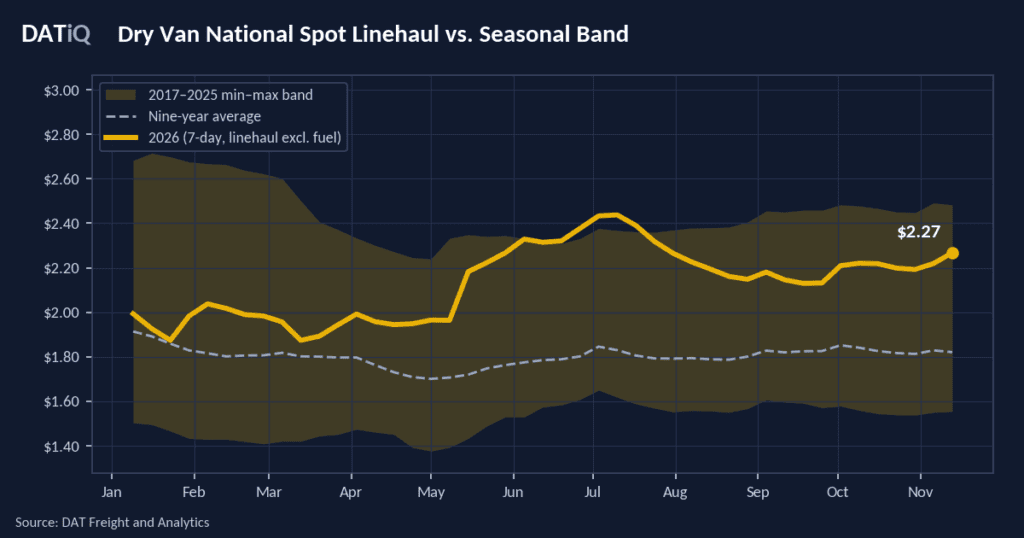
National volume fell 6% week over week, but most of the drop sits on one day. Wednesday, Nov. 11 posted 45% of the previous Wednesday’s volume, and without those two Wednesdays the week ran 5% above the one before. Inference: Veterans Day likely thinned shipping and reporting that day. California volume slipped 4% week over week and 15% year over year as lettuce changed address. Texas fell 20% and 28% on avocados, watermelons, and tomatoes, and Washington rose 3% on apples.
All rates cited are linehaul only. They exclude fuel costs and surcharges unless otherwise noted.
Get the clearest, most accurate view of the truckload marketplace with data from DAT iQ.
Tune in to DAT Market Update, Mondays at 11am Eastern.
The big picture
California produce lanes now run 52% above last year on average, Washington runs 48% above, and Texas runs 18% above. California also owned last week’s rate gains. Santa Maria into Seattle and South and Central California vegetables into Chicago each rose 10% week over week, and the desert into Seattle rose 7%. Washington apple lanes held flat, and Texas slipped 1%.
That reads as a tighter California market and a steady one everywhere else. Inference: Thanksgiving falls on Nov. 26, and holiday freight, from fresh turkeys and hams to e-commerce, Christmas trees, and fall produce, probably competes with produce for the same trucks. That looks like a big part of why California rates rose again on lighter volume. The Top 20 commodities show the fall produce piece: potatoes rose 12% week over week and sweet potatoes rose 38%.
According to USDA, produce spot rates averaged $4.09 per mile for the week ending Nov. 17, and truck availability averaged 4, or slight shortage, on USDA’s 1-to-5 scale. On the 50 lanes published in both years, the average is up 48% year over year, or $1.32 per mile, and 55 of the 76 lanes read 4 or 5, slight shortage or shortage. USDA rates are per-load figures that include broker fees. USDA’s produce data covers refrigerated freight near 34 degrees, while RateView covers all reefer freight, so the two are independent reads. They point the same way.
State scorecard

States are ranked by total weekly volume. Rate figures are simple averages of each state’s lane movements.
California: lettuce moves to the desert
Imperial and Coachella. Romaine and iceberg did the work. Volume in USDA’s Imperial and Coachella section rose 15% week over week and fell 28% year over year, with romaine up 83% and iceberg up 105%. The crossings went the other way: Calexico and San Luis fell 12%, and Nogales, Douglas, and Lukeville fell 22%. Desert lane rates rose 4% on average and run 46% above last year, with Seattle up 7% and Dallas up 6%.
Coast. Lettuce has all but left Salinas-Watsonville. Romaine fell 77% and iceberg 94%, and total volume slipped 9% week over week and held flat year over year because celery, 57% of the section, rose 3% and Brussels sprouts rose 18%. Inference: this is the usual fall handoff of lettuce to the desert. Lane rates rose 4% and sit 47% above last year, led by Chicago at +6% week over week and +38% year over year. Santa Maria volume fell 16% week over week but sits 45% above last year, and its rates rose 5% and run 62% above last year. Seattle gained 10%, tied for the largest weekly move among the report’s districts, and Dallas gained 7%. Oxnard volume rose 10% on celery, which rose 160% and now makes up 41% of the section. Oxnard’s two lanes each gained 3%, and Philadelphia sits 64% above last year.
Kern and South and Central California. Carrots carry Kern’s rate story. Carrot lanes rose 5% week over week and run 62% above last year, with Chicago and New York both up 71% year over year. South and Central California lost 41% of its volume week over week and is down 23% year over year, as iceberg fell 62% and romaine fell 43%. Vegetable lanes rose 2% to 10%, with Chicago at +10% and Baltimore at +7%. The Chicago lane reads +110% year over year, but last year’s lane carried citrus, so that gap compares different baskets. The nine citrus lanes held flat and run 30% to 66% above last year.
Otay Mesa crossings count in California’s total, down 30% week over week and 33% year over year.
Texas, Washington, and the rest
Texas. Avocados drove Texas down. Volume fell 20% week over week and 28% year over year, with avocados down 60%, watermelons down 70%, tomatoes down 24%, and plum tomatoes down 13%. Broccoli, up 32%, was one of the few gainers. Rates averaged -1% week over week and +18% year over year. Chicago gained 2% and sits 38% above last year, Atlanta slipped 5%, and six of the nine lanes held flat.
Washington. Rates did not move on any of the ten lanes. Volume rose 3% week over week and fell 5% year over year, with apples, 59% of the section, up 8%, and pears down 21%. Year over year the ten lanes average 48% higher, from Dallas at +59% down to Seattle at +15%.
North Carolina and Delmarva. North Carolina volume rose 19% week over week and 2% year over year, and sweet potatoes are all of it. Delmarva reported no volume in any of the three comparison weeks, so the scorecard shows n/a.
Commodity trends: holiday freight builds
Three crops carry about a third of the freight. Potatoes (16.6%), apples (9.8%), and dry onions (8.2%) add up to 35% of volume over the past four weeks, and the top 20 commodities together cover 86%. Lettuce is the story that matters: volume rose 12% week over week, and Arizona now supplies 68% of it, up from 2% in the week of Oct. 21, while the central California coast fell from 77% to 17%. Mexican crossings carried 34% of weekly volume in the week of Oct. 21 and carry 27% now.
Avocados are the clearest fade, down 58% week over week and 72% since the week of Oct. 21. Watermelons fell 41% and cranberries fell 35%. The Thanksgiving table is building. Potatoes rose 12%, led by Nebraska at +44%, Colorado at +21%, and Idaho at +13%. Sweet potatoes rose 38%, with Mississippi more than doubling and North Carolina still supplying 67% of the window. Inference: that looks like holiday cooking freight.
What this means for carriers, brokers, and shippers
Carriers. Chase the California lanes into Chicago, because they moved while Washington stood still. Santa Maria into Chicago rose 5% week over week, Salinas-Watsonville into Chicago rose 6%, and South and Central vegetables into Chicago rose 10%, while Yakima-Wenatchee into Chicago held flat at +58% year over year. Price Texas carefully: South Texas into Atlanta fell 5% and sits just 5% above last year, against 52% for the average California lane. Inference: holiday freight probably keeps California capacity tight through Thanksgiving week, so the gains look more likely to hold than to fade. Takeaway: take the desert into Chicago (+5%) and South and Central into Chicago (+10%) before the holiday run pulls those trucks elsewhere.
Brokers. Texas is where cover costs stopped rising, and California is where margin gets squeezed. Texas lanes averaged -1% week over week while California averaged +3%, a gap of about 4 points in one week. Washington sits in the middle, with no weekly movement but rates 48% above last year, so shippers who budgeted off 2025 are already behind. Quote South and Central into Chicago off the +10% weekly move, not the +110% year-over-year figure, which compares different baskets. Inference: with 55 of 76 lanes reading slight shortage or shortage, trucks likely get harder to find as Nov. 26 approaches. Takeaway: tender next week’s Santa Maria and desert loads now, before Santa Maria’s Seattle and Dallas lanes (+10% and +7%) reprice again.
Shippers. Budget California produce at about 52% above last year and Washington at about 48%, and plan Texas at about 18%. Rates softened only on South Texas lanes into Atlanta (-5%) and Baltimore (-2%), so there is little relief to bank. Flexibility on the receiving point is where the savings sit. South and Central vegetables into Philadelphia rose 2% week over week against 7% into Baltimore and 10% into Chicago, and Santa Maria shows the same spread, with New York up 2% and Seattle up 10%. Avocado volume also fell 58%. Inference: if Thanksgiving buyers are still covering avocados, tight supply and a tight truck market may meet on the same load. Takeaway: book California and desert loads for the week of Nov. 23 now, and where the receiver has a choice, send South and Central freight to Philadelphia, the softer of its destinations last week.
About the data
Rates are for Tuesday, Nov. 17, 2026. Week-over-week changes are USDA’s printed changes from Tuesday, Nov. 10, 2026. Year-over-year changes compare the midpoint of each lane’s mostly range with the same origin district and destination city in the USDA report for Tuesday, Nov. 18, 2025. Rates represent open (spot) market sales per load, including brokers’ fees, for 48-to-53-foot refrigerated trailers to ten destination cities: Atlanta, Baltimore, Boston, Chicago, Dallas, Los Angeles, Miami, New York, Philadelphia, and Seattle. Extra charges for terminal-market delivery and multi-stop shipments are not included. USDA’s truck availability rating runs from 1 (surplus) to 5 (shortage).
Volumes are USDA AMS AgTransport reported refrigerated truck movement of fresh fruits and vegetables. The report shows only percentage changes, so the figures are unaffected by the choice of unit. State volume is the sum of the origin districts and crossings in each section.