You wouldn’t know it to look at the weekly trends, but if you take a step back and view the year to-date totals, you may notice that spot market demand has been unusually strong in 2015. In fact, there were more load posts on DAT Load Boards from January through September 2015 than in any other year except 2014 — which was an exceptional year in freight transportation.
What’s different this year? There are lots of loads, but capacity is also abundant, due to the low cost of fuel and a number of other factors. So the load-to-truck ratio — the number of load posts, divided by the number of truck posts — has been discouraging. Last week, the ratio dropped a little more.
Load availability dropped another 3.9% for vans on the spot market last week, while truck posts on DAT Load Boards edged up 2.1%. As a result, the national load-to-truck ratio fell from 1.4 to 1.3 van loads per truck. The ratio was 2.0 for vans in the week ending October 3.
There’s not much pressure on pricing when trucks are readily available. So spot market rates held steady for vans last week, at a national average of $1.72 per mile, compared to $2.00 in October 2014. Today’s number includes an average fuel surcharge of 22¢ per mile. Last year at this time, the fuel surcharge was double today’s amount, at 44¢ per mile.
The cost of operating a truck went down by about that amount, too; diesel cost $3.68 per gallon last year, which is almost $1.20 more than today’s price. At six miles per gallon, that’s a savings of 20¢ per mile. There’s still a 10¢ per mile decline in rates — primarily the line haul portion — that is due to other factors. My colleague Mark Montague delved into some of the details in a recent blog post.
There are still a few bright spots on the map, even for the smallest fleets. Here are a few notable trends from the past week:
 Outbound rates trended up in Los Angeles, but declined in Dallas, Chicago and Atlanta. Rate trends out of Philadelphia were mixed. Rates are derived from DAT RateView and are based on actual rate agreements between freight brokers and carriers, on 65,000 point-to-point lanes across North America. Reference rates (above) include fuel surcharges but not accessorial or other fees. This map of van rates in key regional markets can also be found on DAT Trendlines.
 Seasonal demand was evident in the Northwest, particularly in the Medford, OR, Twin Falls, ID and Missoula, MT markets, and a relative shortage of trucks makes it easy for small carriers to find loads there. The Hot State Map for the week of Oct. 18-24, above, also shows favorable load-to-truck ratios in the Dakotas, but freight volume there is more moderate. Daily maps, along with detailed information on demand, capacity and rates for individual markets and lanes, can be found in DAT Power Load Boards and in DAT RateView.
 TriHaul: Minneapolis – Denver – Rapid City
Freight availability increased in several Midwestern markets last week, including Minneapolis, and outbound rates are well above average.
You can get $2.63/mile for a van load from Minneapolis to Denver – but the return trip is a dreaded “buck-a-mile backhaul” at $1.06/mile, for more than 900 miles. Ugh.
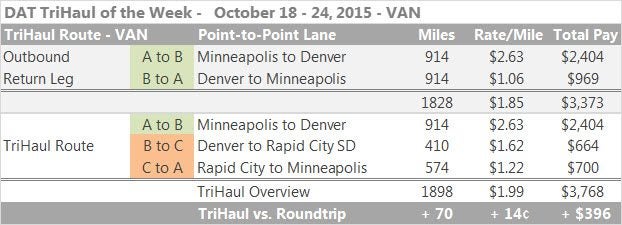
Look for a TriHaul out of Denver, instead, starting with a load to Rapid City, SD. That lane paid $1.62/mile last week. A second load from Rapid City back to Minneapolis paid $1.22/mile, which may not sound great, but the TriHaul adds almost $400 in revenue to the roundtrip, with only 70 extra miles of driving. TriHaul route suggestions are offered in DAT Express and DAT Power load boards, and rates are derived from DAT RateView.


