Van load volume returned to pre-holiday levels during the first full week of the new year. It’s common for pent-up demand to boost freight activity after a holiday, but that pattern doesn’t usually hold up in January. In fact, we expect demand to slump in the weeks after Christmas, but that seasonal lull has been postponed. The slow season has moved to February, and activity should start to pick back up 6 or 7 weeks later, in mid-March.
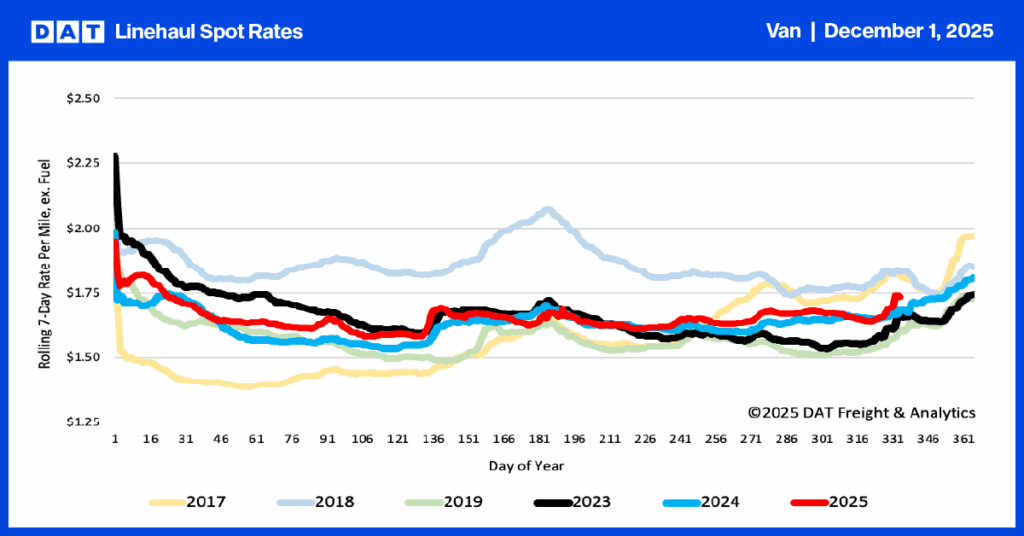
Van rates slipped a couple of pennies lower, to $1.95 per mile, which is still 1¢ above the December average and the highest since January 2019. Even after those adjustments, January is looking sunnier for carriers, as the strong rates and volumes get 2020 off to a good start.
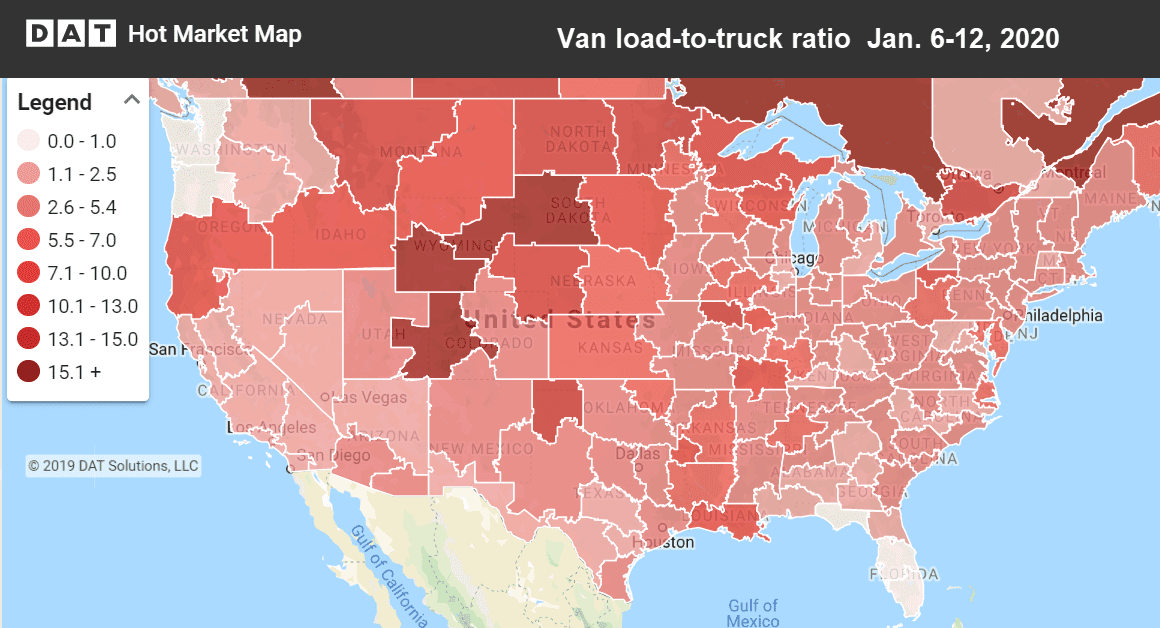
Hot Market Maps, an interactive feature in the DAT Power load board and DAT RateView, depict load-to-truck ratios in 135 freight markets in the U.S.
Last week’s volume rebound also brought more carriers back out to search for loads, so load-to-truck ratios lost some traction. The national average ratio for van equipment edged down but it still rounds to 3.2 loads per truck, which favors carriers. When load-to-truck ratios fall, even a little, rates typically follow. In this case, rates dropped on 73 of the top 100 lanes, and another 13 lane rates were unchanged.
Rising rates are relatively rare
There wasn’t a strong regional pattern in the 14 remaining lanes where rates rose, but two markets had particularly favorable trends: Buffalo, NY and Denver.
- Buffalo to Chicago gained 12¢ to $1.77 per loaded mile, but Chicago to Buffalo lost 26¢, slipping to $2.78. The rate’s still not terrible, but the weather could be.
- Buffalo to Charlotte told a similar story, up 16¢ to $2.43, but the return trip from Charlotte to Buffalo lost 38¢, to $2.24 per mile.
- Denver to Albuquerque rose 9¢ to $2.17, and that lane usually pays the best rate out of Dead-End Denver. Albuquerque to Denver lost 17¢ to $2.30, and it’s hard to find a load on that route.
- Denver to Houston gained 4¢ to $1.31, but there are a lot more loads to Dallas, which paid $1.11 last week. Houston to Denver went for $2.06, up 5¢, and Dallas to Denver lost 6¢ to $2.12.
- Houston to Los Angeles added 3¢ to $1.34, and L.A. to Houston dropped 12¢ to $1.75. That adds to a little less than $5,000 for a long week of driving, but at least there’s not too much snow along the way.
On the downside, it wasn’t a great week for rates out of Los Angeles or Stockton, CA.
- Los Angeles to Chicago rates fell in both directions. The eastbound leg dropped 15¢ to $1.39, and Chicago to L.A. lost 5¢ to $1.50 per mile.
- Stockton to Los Angeles averaged $1.68 per mile last week, down 17¢, and L.A. to Stockton — by far the more popular direction — dropped 12¢ to $2.88
- Stockton to Ontario, CA moved more loads last week, but for less money, with rates down 13¢ to $1.63. Ontario to Stockton added 3¢ to $2.74.
An interesting side note about Ontario, CA. That market is not far inland from L.A., and it’s often associated with agriculture, but it is home to a lot of warehouses and distribution centers for dry goods, as well. That boosted Ontario to the #2 spot among the highest-volume markets for dry van loads in 2019. Ontario is also #3 on the reefer market list. For the rest of the story, see the list of 2019 Top 10 Freight Markets.
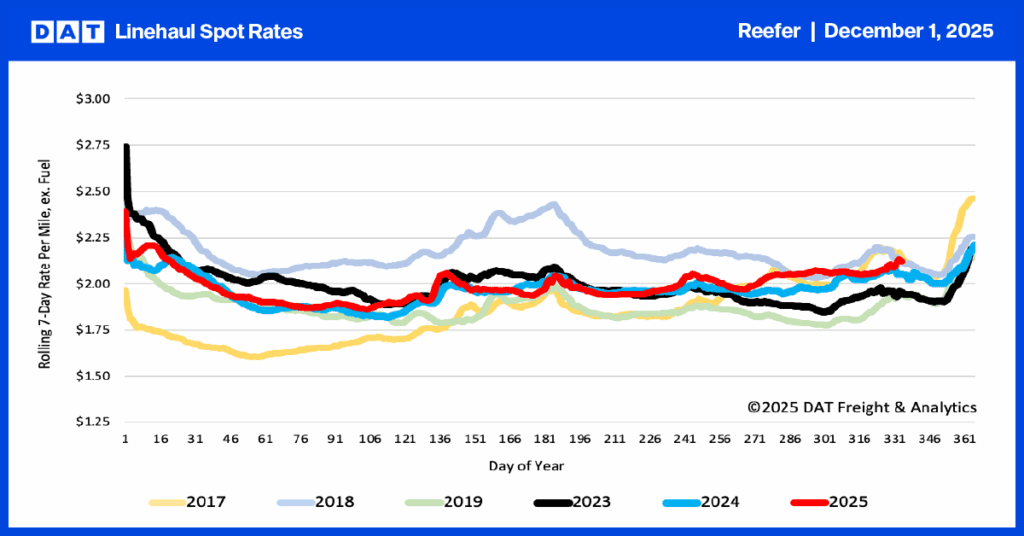
RELATED: Reefer rates stay hot in January