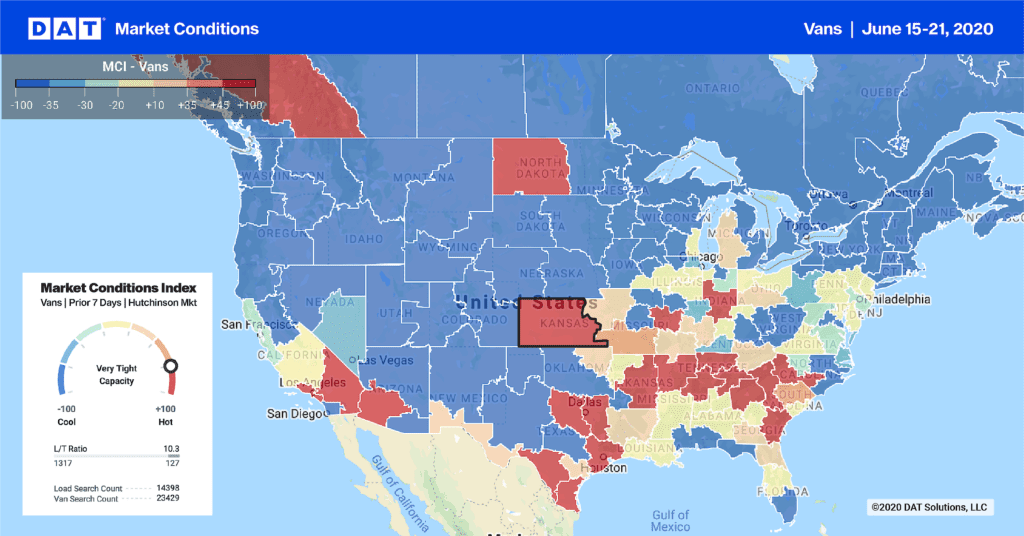
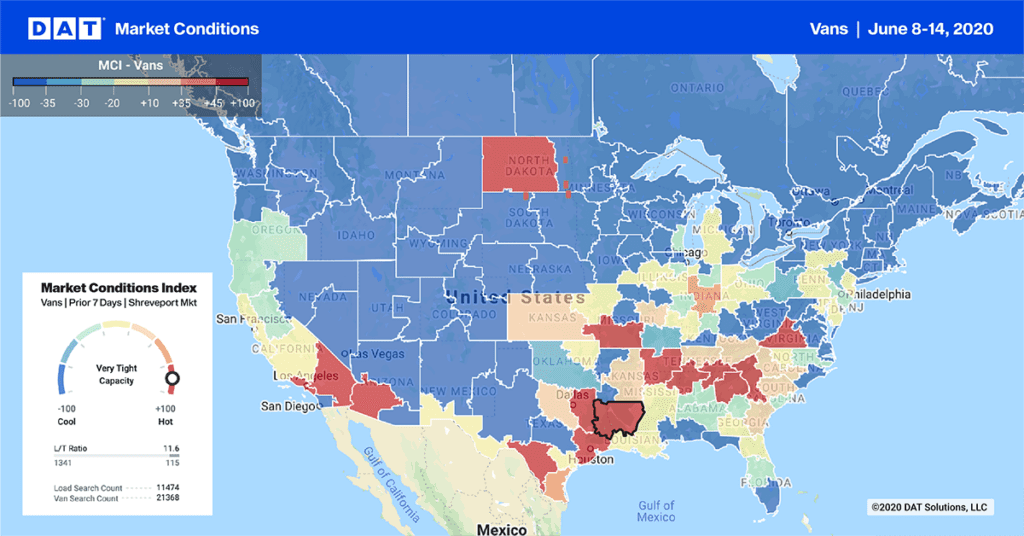
There was a puzzling rise in national rates in the first week of September, many major lanes were in decline while smaller markets seem to have driven the national rates up.
It’s a good reminder that if you find your lanes dropping, there could be better action elsewhere in the country and you can follow the action with DAT RateView, which allows you to see the going rate on any lane in the country.
I was surprised by the results this week, for the following reasons:
1. Rates tend to rise at the end of the month, as shippers rush freight out the door to close the month on a high note. Last week was the first week of September, beginning with Labor Day weekend.
2. Top lanes for van showed a regional shift in favor of the Pacific Northwest, while outbound lane rates dropped in the large population centers on the East Coast. I’d expect national rates to drop too. Maybe backhaul rates rose elsewhere in the country, to balance the national rate.
Van Freight Shifts to the Northwest
Van freight looks pretty straightforward, with a regional shift. The Pacific NW is ascendant at this time, while the East Coast is slipping. That means that the balance of freight is heading into the large population centers. The national average rate rose for vans because as the outbound loads decline in price, the rates on inbound loads tend to trend up. In this case, the inbound loads are the head haul, so the high rate is going up, and the national average reflects that.
There is also demand for vans in agricultural markets. Fall crops can often be hauled in vented vans. Also, reefer capacity shortages tend to drive van rates up, because the reefers are not available to haul excess van freight.
Apples are moving into peak season in the Northwest and upper Midwest, and Idaho potatoes are building volume. In Southern Idaho, the load-to-truck ratio on DAT Load Boards nearly doubled early this week, from 17.4 to 35.6 loads per truck. Eastern Washington State, a prime apple growing region, jumped from 13.3 to 34.8. Fresno also moved up last week, from a ratio of 6.5 to 8.3, with a surge in demand. The grape harvest is still in progress, and will continue for a while.
In the Midwest, Michigan harvests are hitting the peak, and the load-to-truck ratio is holding at 21.0. In Minnesota, the ratio is up from 11.9 to 20.5. Central Wisconsin (Appleton, Green Bay, Marshfield, Plover, etc.) has moved from 37.3 to 59.6 Upstate New York is also harvesting apples and other tree fruit, and the load-to-truck ratio there jumped from 9.4 to 15.5.
Reefer Loads Abound, in Some Unfamiliar Places
Reefer rates did not rise in top lanes last week, even though the national average spiked. My conclusion: We are comparing the first week of September against the whole month of August when we look at national rates. August rates started strong, then slumped and finally rose in the last few days of the month.
Compared to those last few days of August, rates are are down week over week, but they are about the same as they were in the last week of August. Some of the “odds and ends” lanes, the ones that don’t usually conforrm to an overall trend, are up from their August levels, meanwhile, with plenty of reefer freight from places like Fort Smith, AR, Indianapolis, IN, and Jackson, MS that we don’t normally measure.
Fort Smith, in Northwest Arkansas, could be a shipping area for poultry, a back-to-school grocery staple. Indianapolis is a warehousing center for refrigerated foods, candy & confectionery, also possibly sweet corn. Jackson, MS should be shipping sweet potatoes and a few other crops at this time of year. Meanwhile, central and southern Florida has very little volume and the outbound load-to-truck ratio has plummeted to 0.5. Florida is a backhaul market for 10 months of the year, so this is not a surprise, but it’s a very sharp contrast to the booming freight season we saw in May. Phoenix is also out of season, so inbound loads are commanding a high rate — with a big boost on the lane from Ontario CA — but there isn’t much available for the return trip.
Load-to-Truck Ratios Indicate Capacity Pressure
I keep mentioning the load-to-truck ratio because it is one of the best indicators of pressure in the freight marketplace. As demand increases or capacity tightens, or both, there is typically a response in the spot market rate. If the change is sustained, rather than a seasonal blip, the contract rates paid by shippers will often follow. When I say “often,” I mean more than 70% of the time, statistically speaking. So the load-to-truck ratio is an extremely sensitive advanced indicator of the kind of pressure that drives rate increases over time. Keep your eye on that number.
You can track the 13-month history of load-to-truck ratios for each lane in DAT RateView, alongside the rate history for the same period. Taken together, these two data displays provide a powerful basis for predicting the impact of demand and capacity shifts in your most important markets and lanes.


