Even with the backlog of container ships waiting to unload on the West Coast, volumes appear to be slowing based on the latest import volume data from PIERS. Although total loaded import container volume in April was up 31% since last year, total TEU (twenty-foot equivalent unit) volume decreased by almost 4% in a month.
Furniture remains the number one imported commodity in containers at 13%. This is followed by female apparel at 6% and footwear at 5%. At the port level there was a noticeable shift in volumes from March to April.
At the Port of Los Angeles, the country’s number one port for imported containers, volumes were up 16% since last month. While on the East Coast in New York, Savannah and Charleston, volumes were down 7% at each port. The biggest monthly changes were recorded in Mobile where volumes dropped 26% and in Vancouver B.C. where volumes increased by 27%.
Find loads and trucks on the largest load board network in North America.
Note: All rates exclude fuel unless otherwise noted.
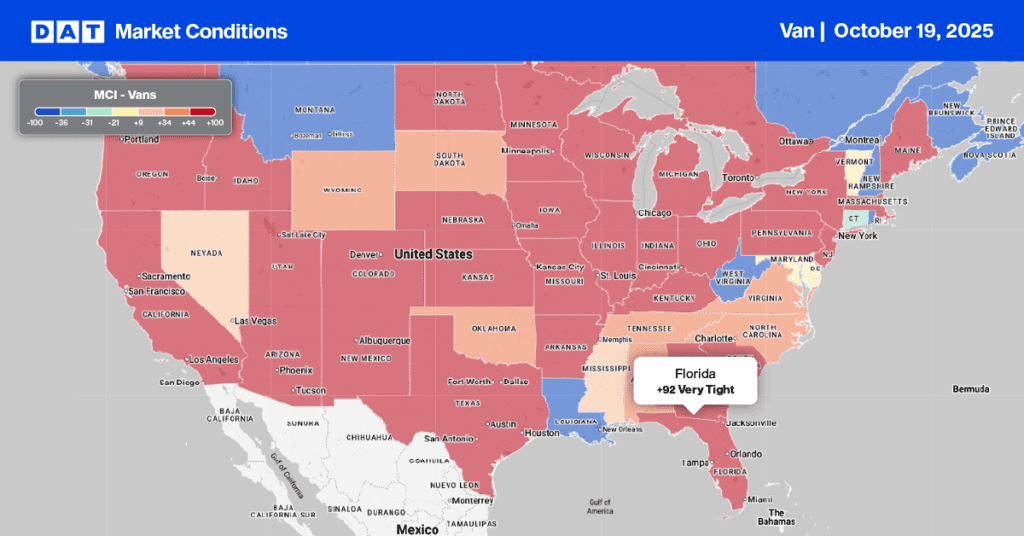
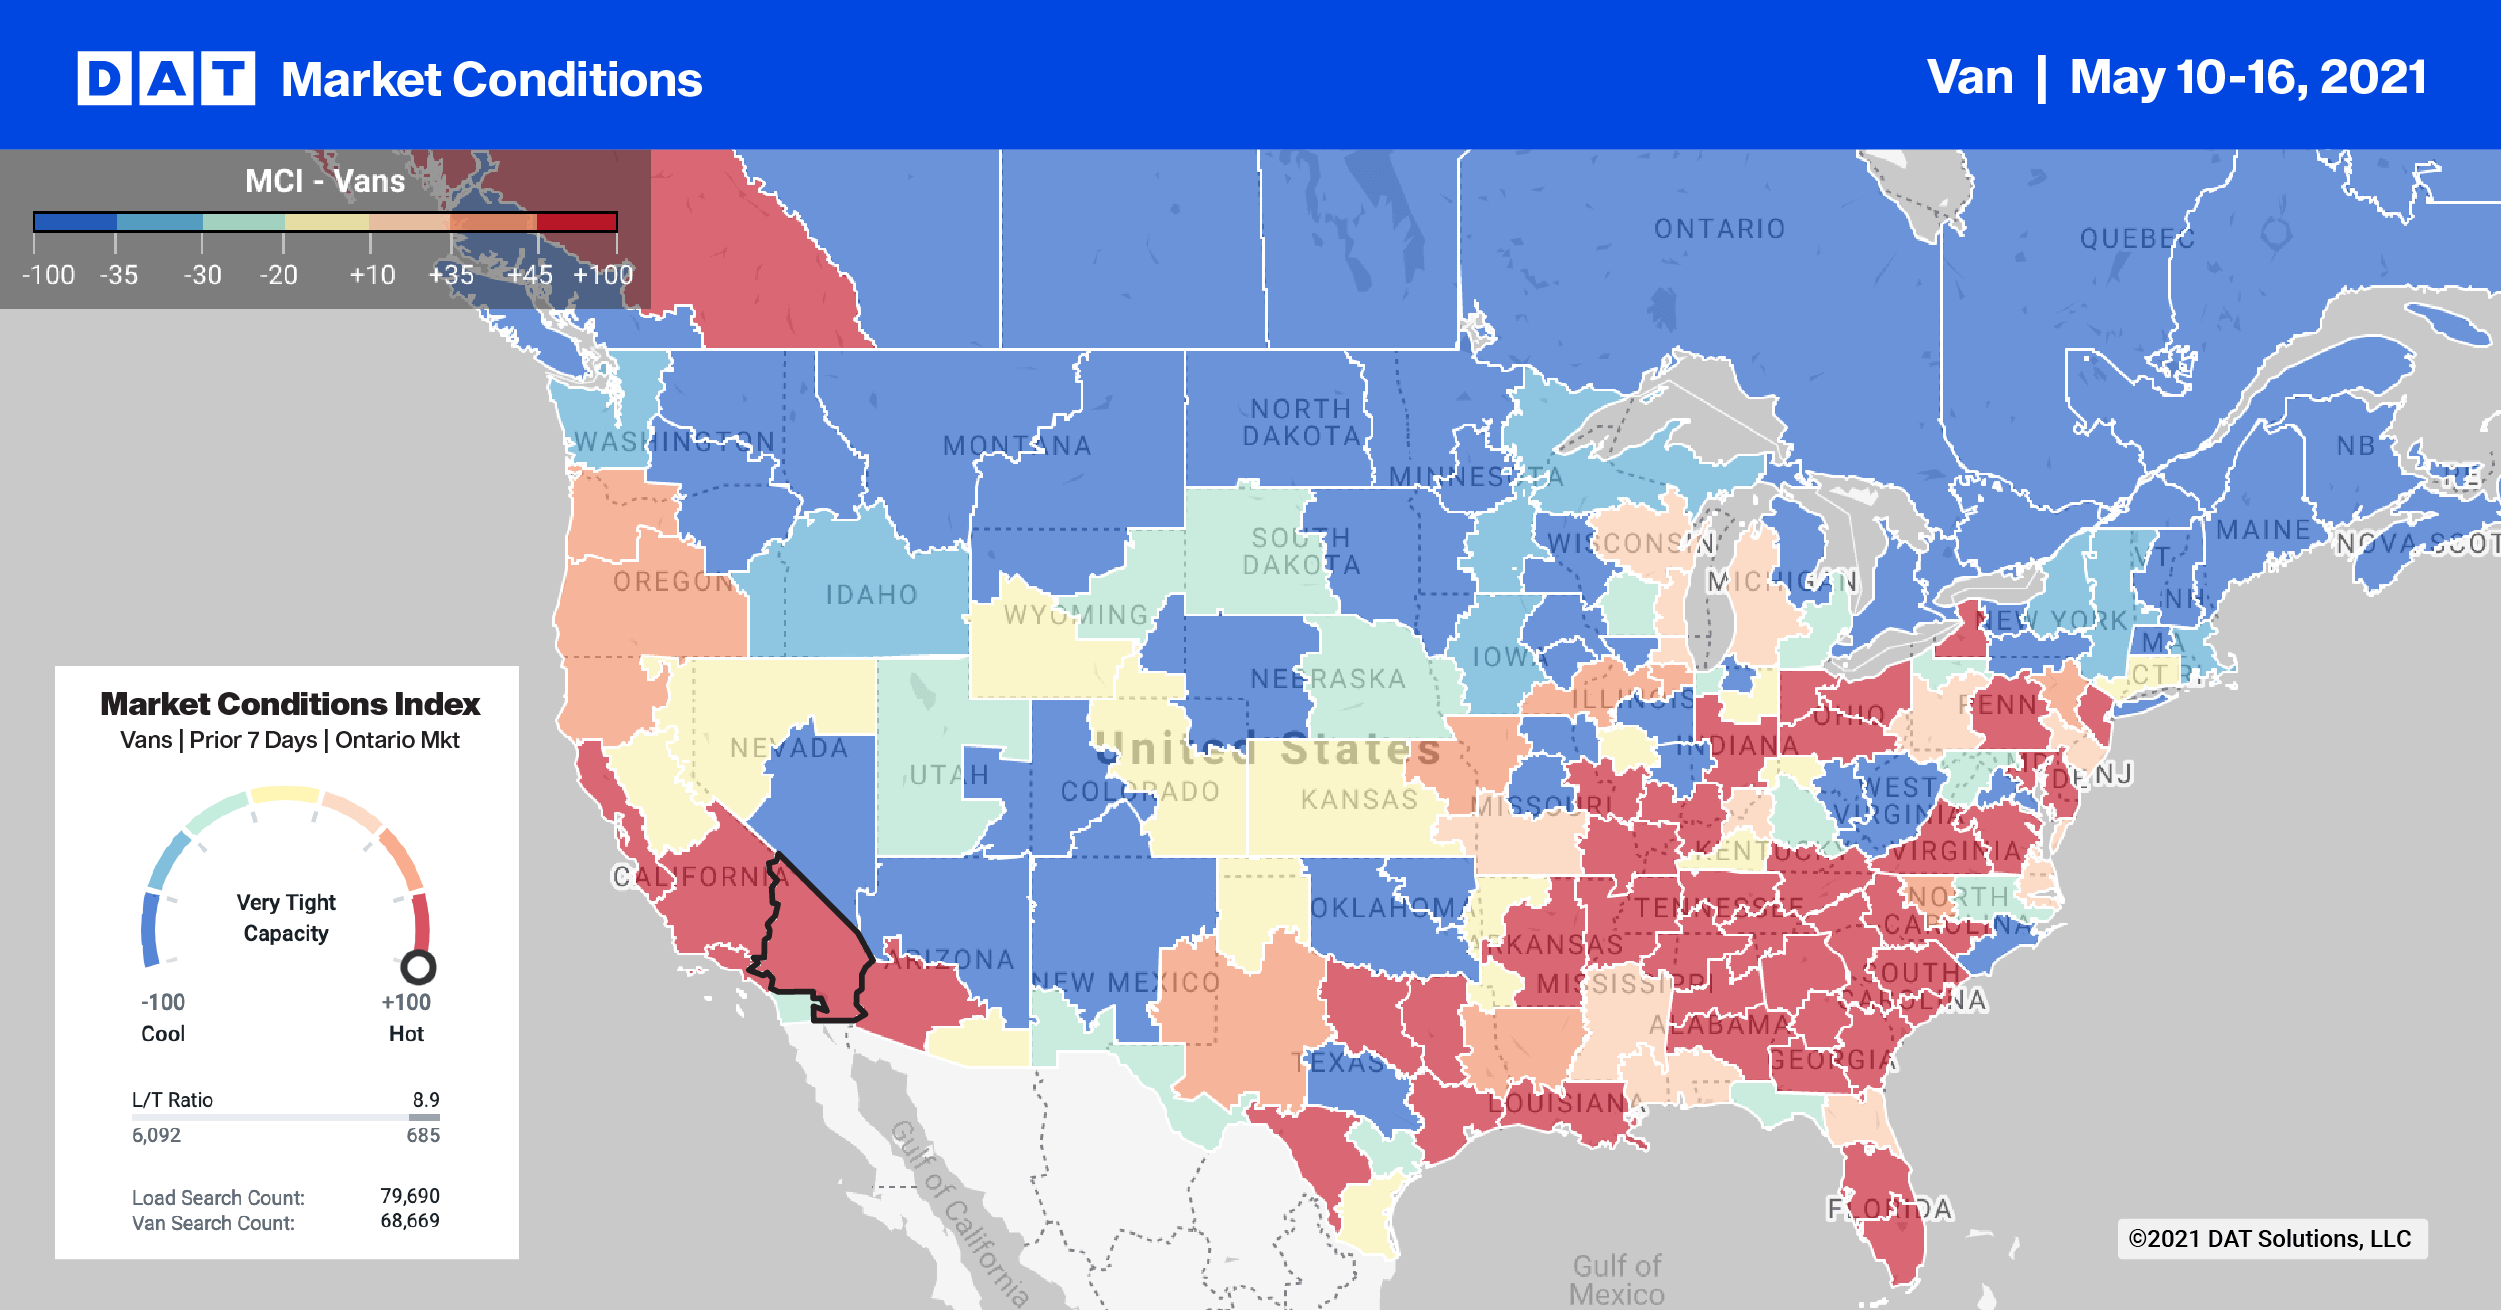
In the Top 10 markets, volumes were down 5% last week while rates were up an average of $0.05/mile as a result of so many carriers still re-entering the market after Roadcheck Week.
Weekly outbound load post volumes in Atlanta dropped by 4%, but capacity was still tight pushing spot rates up by $0.12/mile to an average of $2.65/mile. The same trend was evident in other Top 10 markets:
- Memphis volumes dropped 4% even though rates increased by $0.03/mile to $2.84/mile.
- Lakeland volumes declined 13% as its produce season winds down. However, its capacity was still tight with rates up $0.09/mile to $2.10/mile.
Spot rates
The dry van spot market settled down quickly following the prior week’s acute capacity crunch. Following the $0.13/mile increase created by Roadcheck Week, dry van rates were flat last week and stayed at $2.42/mile. For context, spot rates are now $1.02/mile higher than this time last year and $0.60/mile higher than the same week in 2018.
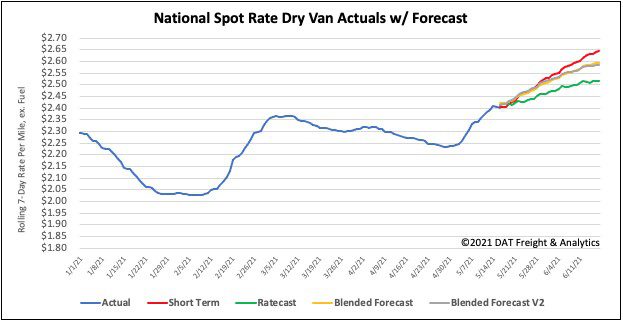
How to interpret the rate forecast:
- Ratecast: DAT’s core forecasting model
- Short Term Scenario: Formerly the pessimistic model that focuses on a more near-term historical dataset
- Blended Scenario: More heavily weighted towards the longer-term models
- Blended Scenario v2: More heavily weighted towards the shorter-term models