Truck freight activity in the United States took a step back in September, dropping the for-hire tonnage level to its lowest point in three months. According to the American Trucking Associations’ (ATA) advanced seasonally adjusted For-Hire Truck Tonnage Index, truck freight tonnage declined 0.9% in September, reversing modest gains from July and August. The index landed at 114.2 (based on 2015=100). Despite this monthly dip, ATA Chief Economist Bob Costello noted that tonnage is still up 2.1% from its low in January. However, compared to the peak three years ago, the market remains soft, still sitting 3.9% off its high.
Get the clearest, most accurate view of the truckload marketplace with data from DAT iQ.
Tune into DAT iQ Live, live on YouTube or LinkedIn, 10am ET every Tuesday.
September’s results from the trucking sector, which hauls over 72% of all domestic freight, highlight the continued instability within the broader U.S. economic environment. The freight market is experiencing a sustained period of volatility, as evidenced by the mixed signals in the trucking industry. While a 0.8% year-over-year increase in September offers a small positive, it does not negate the challenges of the current economic cycle. These figures, primarily reflecting contract freight, are derived from surveys of ATA members, a practice that has been in place since the 1970s.

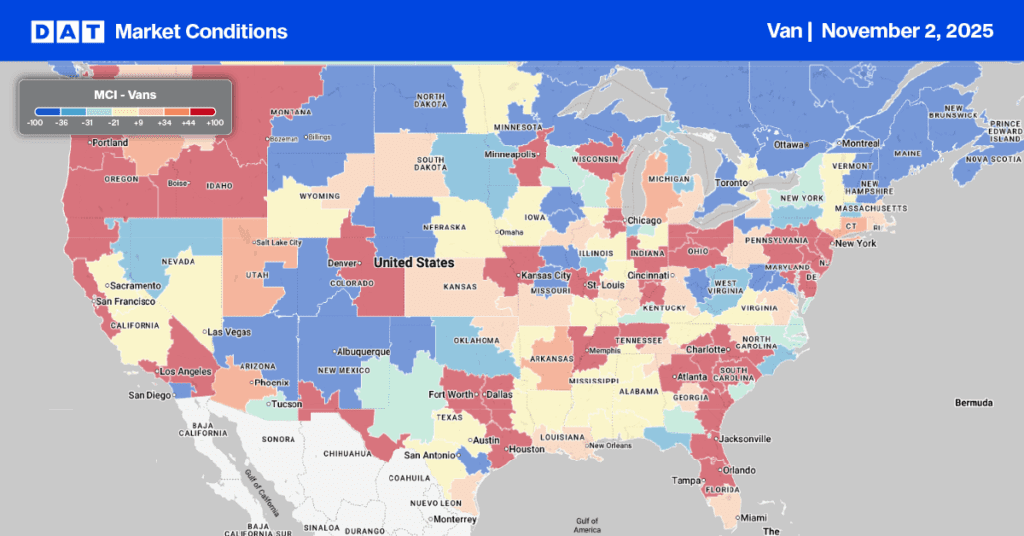
Dry Van Market Conditions Index
Last week, the dry van load-to-truck ratio rose to 6.59. This increase was primarily due to a 9% decrease in available equipment posts and a slight, unexpected decline in load posts at month-end. Historically, the dry van spot market sees a 13% surge in load post volume at month-end during Halloween, as shippers typically clear their docks and manage last-minute e-commerce replenishment. However, this year, load post volumes decreased by just over 1%.
Tight dry van capacity persisted along the southern border in Texas and Arizona, as reported by brokers, attributed to ongoing Immigration and Customs Enforcement (ICE) activities. Load posts in these regions surged 17% week-over-week. Notably, the Nogales freight market experienced the most significant capacity crunch, with a 35% weekly increase in load posts. Laredo, the largest dry van spot market and commercial crossing point from Mexico, saw a 20% weekly rise in volume, while McAllen’s load post volumes also jumped by 34%.
National dry van linehaul spot rates
Dry van linehaul spot rates erased the prior week’s gains, decreasing by $0.02 per mile last week, averaging $1.70 per mile, $0.04 or 3% higher than the same time last year and $0.14 higher than in 2023.
The average rate for DAT’s top 50 lanes by load volume remained unchanged for the third week, averaging $2.00 per mile and $0.28 higher than the national 7-day rolling average spot rate.
In the 13 key Midwest states, which represent 46% of national load volume and often indicate future national trends, spot rates decreased by $0.01 per mile to $1.94 per mile, which was $0.24 above the national 7-day rolling average.


