Industrial production increased by 1.4% in March, which is welcome news after falling 2.6% in February.
Manufacturing production and mining output also increased 2.7% and 5.7% respectively in March. While March is still down 3.4% overall compared to February of last year, the economy continues to make progress.
Retail freight surged in 2020, according to the Retail Truck Tonnage Index, which was created by supply chain professors Yemisi Bolumole and Jason Miller of Michigan State University.
The index converts the advanced monthly retail trade sales data (excluding motor vehicles, parts dealers and gas stations) from the U.S. Census Bureau to actual tonnage of freight hauled in the for-hire and private fleet sectors. Some key takeaways of the index include:
- From March 2019 to December 2019, the average tonnage increased by 3.3% from 2018
- In 2020, the average tonnage increased by 9.5%
- March 2021 has outpaced March 2020
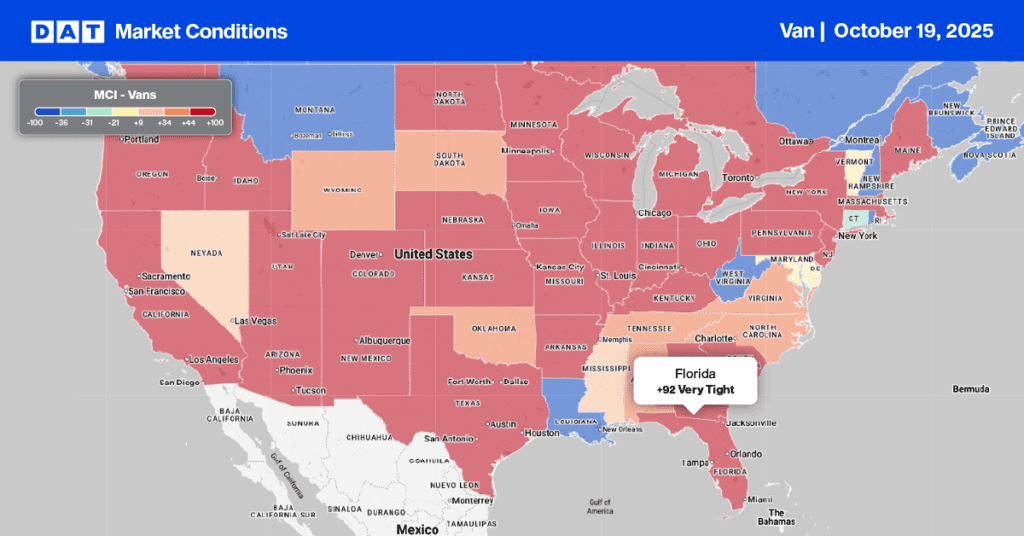
Find loads and trucks on the largest load board network in North America.
All rates exclude fuel unless otherwise noted.
Average spot rates in the top 10 markets (which represents 25% of weekly volumes) dropped another $0.03/mile last week as load post volumes dropped by 8%. The average rate was down $0.02/mile to $2.45/mile.
- Atlanta load post volumes dropped 9% and capacity remained tight as rates increased by $0.01/mile to an average of $2.39/mile
- Ontario, CA, capacity eased with a decrease of $0.01/mile to $3.01/mile
- Los Angeles capacity eased with a decrease of $0.01/mile to $2.90/mile
On the high-volume Los Angeles to Phoenix lane, spot rates continued to climb and are now at $4.30/mile, which is up $2.25/mile compared to the same time last year.
Outbound rates in Denver, traditionally a backhaul market, increased by 1% last week. Seven-day rates are near $1.40/mile, which is $0.40/mile higher than the same week in 2020.
Spot rates forecast
Dry van spot rates appeared to have peaked at $2.37/mile at the start of March. Rates decreased for the third week in a row, albeit only slightly. Spot rates dropped another $0.02/mile to end the week at $2.31/mile. Compared to the same week in 2020, spot rates are now $0.95/mile higher and still $0.48/mile higher than the same time in 2018.
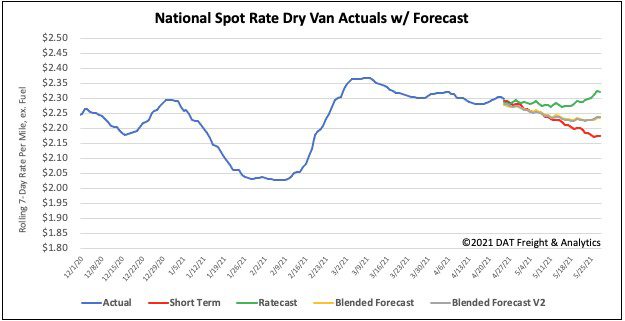
How to interpret the rate forecast:
- Ratecast: DAT’s core forecasting model
- Short Term Scenario: Formerly the pessimistic model that focuses on a more near-term historical dataset
- Blended Scenario: More heavily weighted towards the longer-term models
- Blended Scenario v2: More heavily weighted towards the shorter-term models