There’s still a surreal sight of record numbers of ships drifting off the coast of Los Angeles. Vessels are waiting an average of 19 days to unload their cargo. The longest wait to unload has been 58 days so far.
Find loads and trucks on the largest load board network in North America.
Note: All rates exclude fuel unless otherwise noted.
While there are plenty of vessels waiting at anchor, it’s trending down. As of Monday November 29, there were 57 container vessels at anchor compared to a record 86 just two weeks ago.
In addition to holding vessels further offshore to address pollution concerns (from idling vessels closer to shore), more container vessels are now slow-steaming across the Pacific. This creates an illusion that the port congestion is easing.
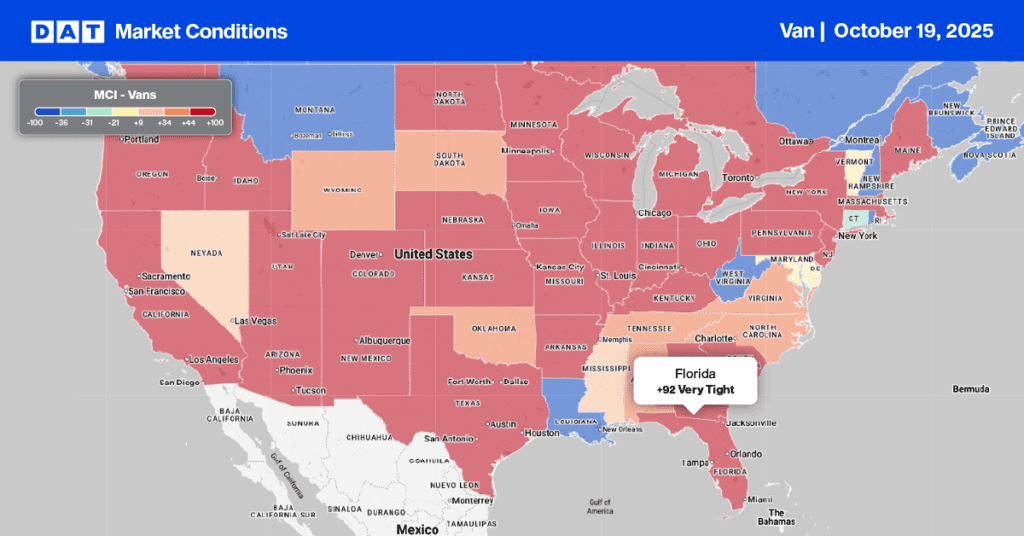
While the number of vessels at anchor is decreasing, there are still just over 600,000 TEU (twenty-foot equivalent unit) containers in the pipeline waiting to offload in Los Angeles ports. As a result of the congestion and higher overall freight volumes, spot rates in California surged $0.15/mile last week to a state average of $3.55/mile last week. The Los Angeles to Phoenix lane set a new record of $4.83/mile.
After weeks of rain in the Pacific Northwest (PNW), rail in British Columbia has been disrupted due to flooding. Loads that normally move by rail had to be moved by truck. Spot rates were up for the fourth week in a row and are now averaging $2.68/mile — up $0.29/mile during November. Loads moved from Seattle to Chicago are up 20% from the previous month.
Spot rates
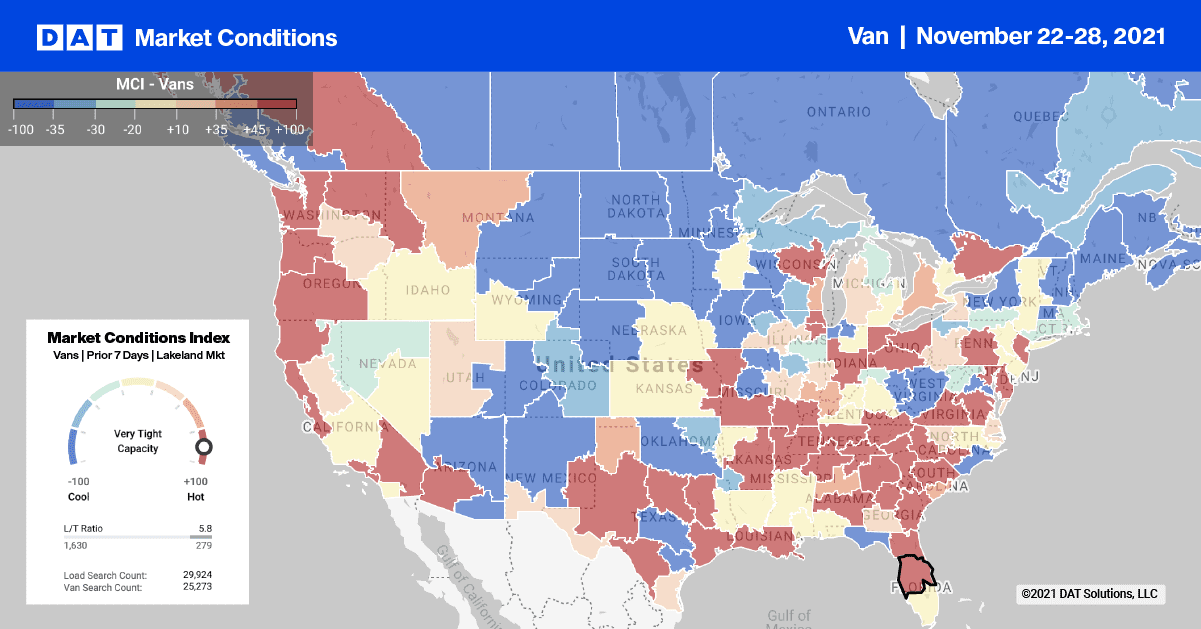
Despite the short work week and drop in load volumes, there was an even sharper drop off in carrier equipment posts last week. Both shippers and brokers saw an acute capacity crunch.
Last year, equipment posts dropped 28% in the week of Thanksgiving compared to this year’s 36% decrease. As a result dry van spots rates spiked by $0.07/mile to a national average of $2.61/mile.
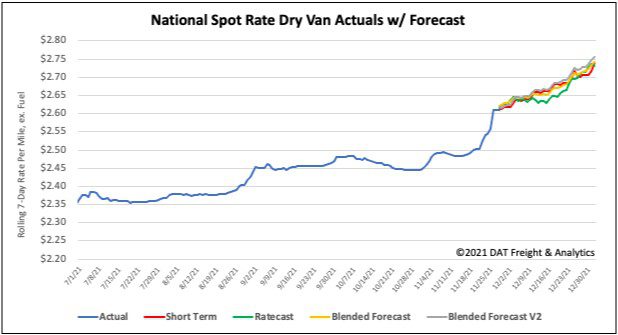
How to interpret the rate forecast:
- Ratecast: DAT’s core forecasting model
- Short Term Scenario: Formerly the pessimistic model that focuses on a more near-term historical dataset
- Blended Scenario: More heavily weighted towards the longer-term models
- Blended Scenario v2: More heavily weighted towards the shorter-term models