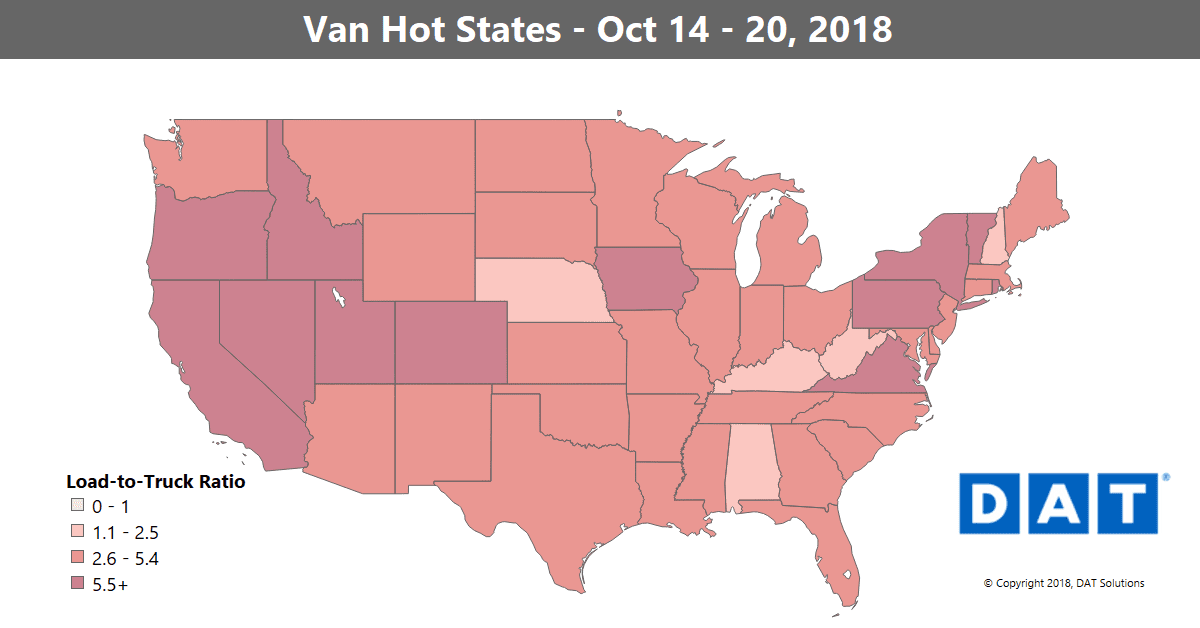
West Coast van freight heated up last week, especially in the Los Angeles market. Blame the weather. Even from a great distance, three September storms had an impact on California cargo in mid-October.
In mid-September, we were focused on evacuating the Carolinas and diverting trucks and freight away from Hurricane Florence. Cargo ships were re-routed or delayed en route to and from ports from Savannah to Baltimore.
During the same week, Typhoon Mangkhut made landfall in the Philippines as a Category 5 storm, destroying lives and property in its path. Mangkhut weakened as it moved on to Hong Kong and other ports and manufacturing centers in Southeastern China, but high winds and flooding damaged property and infrastructure.
Ships in and near Hong Kong were delayed, which caused a disruption of traffic at the top U.S. destination, the combined Ports of Los Angeles and Long Beach. Together, those two ports receive almost 50 percent of Asian imports to the U.S. It takes a couple of weeks for container ships to make their way across the Pacific, and the typhoon caused schedule disruptions at West Coast ports through the end of the September and beyond.

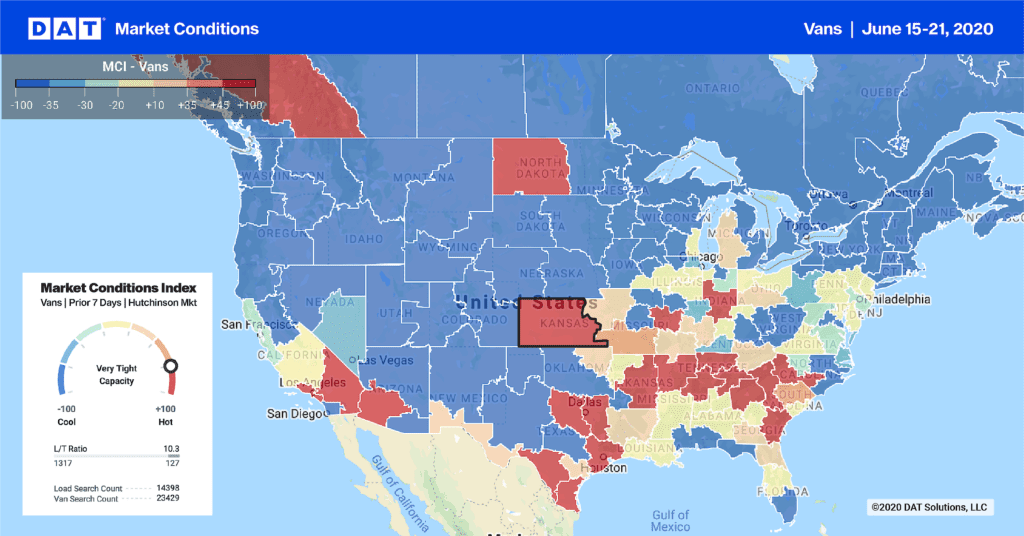
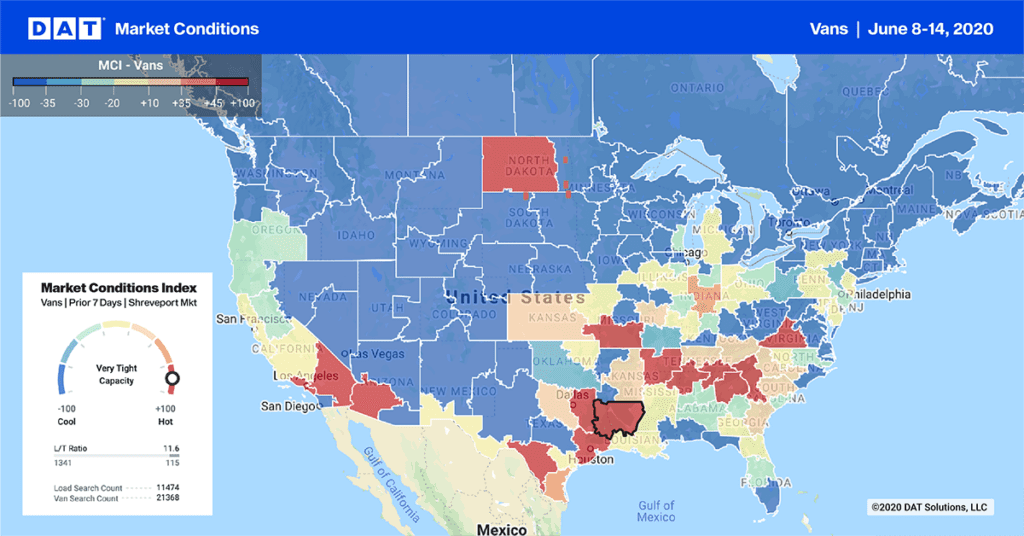
The national load-to-truck ratio for vans held steady last week at 4.7 loads per truck, with areas of tighter capacity along the West Coast. The load-to-truck ratio represents the number of loads posted for every truck posted on DAT load boards. The ratio is a sensitive, real-time indicator of the balance between demand and capacity. Changes in the ratio often signal impending changes in freight rates.
Meanwhile, less than a month after Florence and Mangkhut, Hurricane Michael slammed into the Gulf Coast of Florida. Michael was a mightier storm, but it had little direct impact on West Coast freight. Still, any storm of that magnitude draws resources, including trucks, to assist in emergency relief. That leaves fewer trucks available to pick up the slack in California.
While it’s common for freight volume to increase on the West Coast in October, the three concurrent storms caused churn in the L.A. market and drove up load-to-truck ratios last week. Outbound ratios rose from 5.0 loads per truck for the month to-date to 8.4 on Friday, as the re-scheduled freight emerged from warehouses and headed east and north. Rates rose 8¢ to $2.18/mile on the lane from L.A. to Atlanta, but other lanes out of L.A. lost traction.
Apart from L.A. to Atlanta, rates rose on a handful of other lanes originating in the West:
- Seattle to Eugene, OR, added 9¢ to $3.07/mile
- Seattle to Los Angeles also rose 9¢ to $1.48/mile
- Denver to Albuquerque got a 7¢ increase, to $2.18/mile
On the down side, some lanes out of Chicago had big drops last week. It wasn’t just Chicago, either. Looks like there are a lot of empty trucks in the Midwest:
- Chicago to Buffalo plunged 20¢ to $2.92/mile
- Chicago to Dallas dropped 18¢ to $2.17/mile
- Chicago to Allentown, PA, lost 17¢ to $2.82/mile
Find loads, trucks and lane-by-lane rate information in DAT load boards, including rates from DAT RateView.


