Over the past 20 years, the volume of fresh vegetables imported by the U.S., primarily from Mexico and Canada, rose nearly 200%. Driving this increase has been market share increases, new trade agreements, lower foreign exchange rates and increased domestic consumption.
Even though the U.S. imports produce from more than 125 countries, Mexico and Canada are the main suppliers of produce. This year, Mexico and Canada supplied 77% and 11% of our produce respectively.
Find loads and trucks on the largest load board network in North America.
Note: All rates exclude fuel unless otherwise noted.
On the northern border, potatoes from Prince Edward Island (PEI) and Manitoba dominate total volumes. They account for 28% of the annual produce imports from Canada.
Even though the PEI potato harvest season is almost over, volumes of potato imports have tripled in the last three months with most of that volume crossing the border in Maine. Canadian import volumes remain relatively constant year-round except for the bump in volume during the potato season.
Imports from Mexico are more seasonal. Mexican produce import volumes peak between March and May each year. They typically begin to increase in November, leading into peak avocado shipping season right before the U.S. Superbowl. Tomatoes are the leading import at 14% of the annual total followed by avocados and cucumbers, both at 7%.
Just under 50% of Mexico’s annual volume crosses through the state of Texas. The McAllen freight market alone accounts for 35% of the annual volume. This is followed by Nogales, AZ at 25% of the volume.
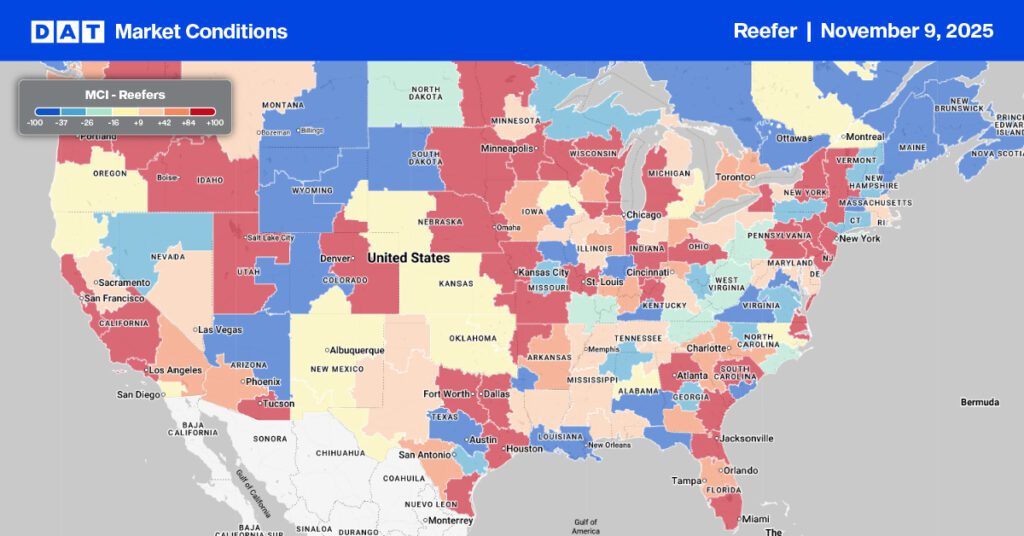
Load post volumes dropped in all of the top 10 reefer markets last week by 18%. Reefer capacity also eased with the Top 10 average spot rate down $0.04/mile to an average of $3.27/mile, which is down $0.13/mile since Thanksgiving.
As expected, capacity tightened slightly in McAllen as spot rates inched higher by $0.01/mile last week to an average outbound rate of $2.58/mile. McAllen load post volumes have been climbing steadily and are now up 46% in the last three weeks.
Spot rates for loads to the top two destinations out of McAllen last week held steady on loads to Atlanta at $2.18/mile, while loads to Brooklyn, NY continue to climb. Last week’s average rate from McAllen to New York City was $3.07/mile, which represents a $0.50/mile increase since September.
In contrast, capacity eased on DAT’s number one reefer lane between Atlanta and Orlando where spot rates are down $0.38/mile since November to an average of $3.85/mile.
Spot rates
Spot rates for temperature-controlled equipment have plunged by $0.09/mile since the record-high $3.04/mile linehaul rate recorded in the week prior to Thanksgiving. Reefer spot rates dropped $0.04/mile last week to a national average of $2.95/mile. That’s still 20% or $0.58/mile higher than the same week last year and almost $0.90/mile higher than the same period in 2018.
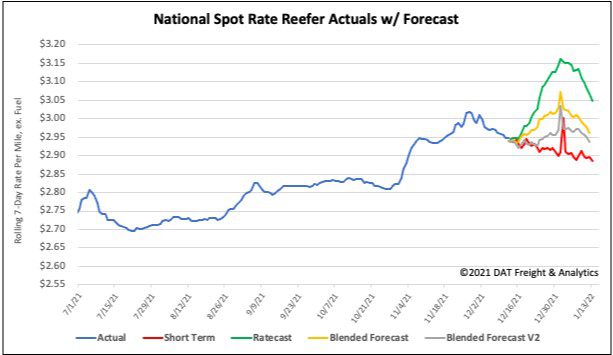
How to interpret the rate forecast:
- Ratecast: DAT’s core forecasting model
- Short Term Scenario: Formerly the pessimistic model that focuses on a more near-term historical dataset
- Blended Scenario: More heavily weighted towards the longer-term models
- Blended Scenario v2: More heavily weighted towards the shorter-term models