Peak-season shipping is well and truly underway, especially on the West Coast where about a third of all imported containers arrive. Port congestion in the San Pedro Complex is at record high levels with 56 container vessels at anchor. This surpasses the record of 40 set back in February this year.
Get the clearest, most accurate view of the truckload marketplace with data from DAT iQ.
Tune into DAT iQ Live, live on YouTube or LinkedIn, 10am ET every Tuesday.
According to the Port of Los Angeles SIGNAL report, the number of twenty-foot equivalent units (TEU) due to arrive this week will be in the vicinity of 170,000. This will be 53% higher than the same week last year. With wait time at anchor already averaging 8.5 days, many shippers are facing lengthy delays that eat into the allotted shipment time for inland moves.
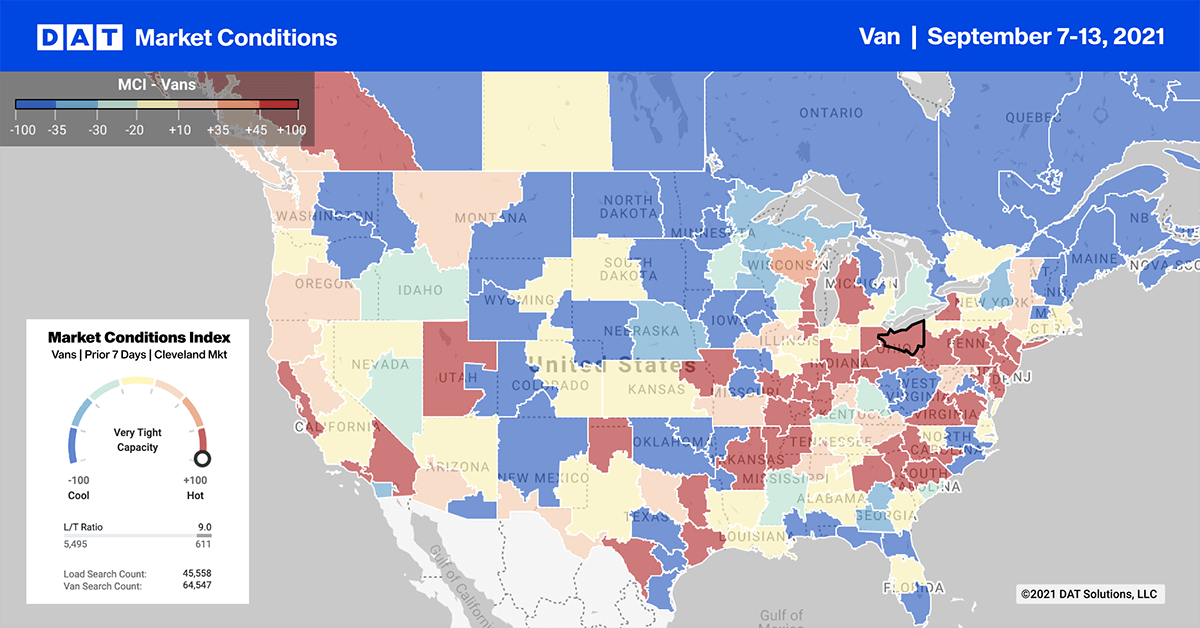
Inland intermodal congestion has pushed more shippers over to the truckload sector for the inland move. This partly explains why DAT Freight & Analytics is seeing such high spot market volumes and rates on the West Coast.
Find loads and trucks on the largest load board network in North America.
Note: All rates exclude fuel unless otherwise noted.
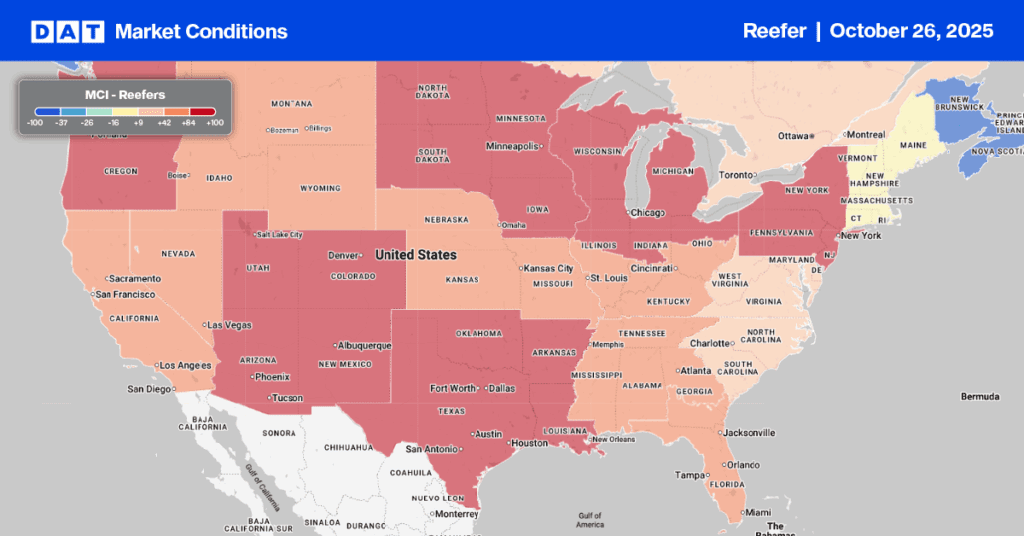
Dry van capacity is still tight as the Los Angeles market average spot rates reach $3.18/mile — up $0.10/mile in the last three weeks. On the e-commerce benchmark lane from Los Angeles to Phoenix, spot rates are averaging $4.26/mile, which is $0.42/mile higher than the same week last year.
Despite declining volumes, capacity continues to tighten in the Philadelphia market following four weeks of rate increases:
- Spot rates have climbed $0.16/mile since mid-August to reach an average outbound rate of $2.55/mile last week
- On the 250-mile haul to Richmond, VA, spot rates hit a record-high $4.38/mile last week — up $0.17/mile compared to the average for August
- Loads to Atlanta hit $2.40/mile last week following a $0.24/mile increase over the prior week
- The 469-mile haul to Columbus, OH, averaged $3.02/mile last week, $1.35/mile higher than the same week last year
Spot rates
After remaining relatively flat for the last month, national dry van spot rates broke through the $2.50/mile barrier for the first time last week. Rates increased by $0.05/mile last week to $2.51/mile despite a 20% decrease in load volumes. This is a sign of just how tight truckload capacity is ahead of peak shipping season.
Compared to the same week last year, dry van rates are $0.35/mile higher.
Of our Top 100 lanes (for loads moved), spot rates:
- Increased on 40 lanes (compared to 49 the week prior)
- Remained neutral on 34 lanes (compared to 31)
- Decreased on 26 lanes (compared to 20)
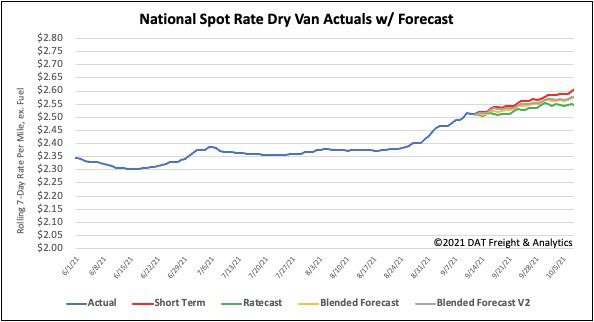
How to interpret the rate forecast:
- Ratecast: DAT’s core forecasting model
- Short Term Scenario: Formerly the pessimistic model that focuses on a more near-term historical dataset
- Blended Scenario: More heavily weighted towards the longer-term models
- Blended Scenario v2: More heavily weighted towards the shorter-term models