The Census Bureau’s April Durable Goods Order data provides some insight into what we can expect from the manufacturing sector. The sector is a significant component of the economy and a large contributor to truckload tonnage.
The data confirms some of the supply chain disruptions impacting the trucking industry. Overall orders for durable goods dropped 1.3% in April with the decline due almost entirely to a 6.2% drop in orders for new cars and trucks. The April decrease comes after 11 consecutive monthly increases.
Just like in the truckload sector, manufacturing doesn’t have a demand problem. It has a supply problem with equipment manufacturers unable to meet demand for new vehicles due the global shortage of computer chips.
Durable goods shipments increased 0.6% in April, which have been increasing in 11 of the last 12 months and are now up 12.1% since last year. Despite the worse than expected result, April’s 2.3% increase in capital goods spending points to strong underlying demand driven by the expectation that supply chain shortages will eventually resolve themselves.
Next week’s Amazon Prime Day will provide another boost in short-term demand but not just for Amazon. All online retailers will have Black Friday level deals in most sale categories.
Find loads and trucks on the largest load board network in North America.
Note: All rates exclude fuel unless otherwise noted.
Even though load post volumes bounced back after the Memorial Day weekend, capacity loosened in the Top 10 markets with spot rates dropping by an average of $0.02/mile to $2.53/mile.
Atlanta remains the number one market for load posts and after a 3% increase in volume. Rates dropped by just $0.01/mile to an average of $2.69/mile last week.
There was very little change in capacity levels on the West Coast despite large increases in volumes. Ontario, CA recorded a 25% increase in volume with rates staying at $3.20/mile. Los Angeles saw similar numbers with a 19% increase in volume and rates staying at $3.09/mile.
Spot rates
Dry van spot rates lost almost all of the gains from the week prior dropping $0.03/mile to $2.36/mile last week. Dry van spot rates are still $0.76/mile higher than this time last year and $0.35/mile higher than the same week in 2018.
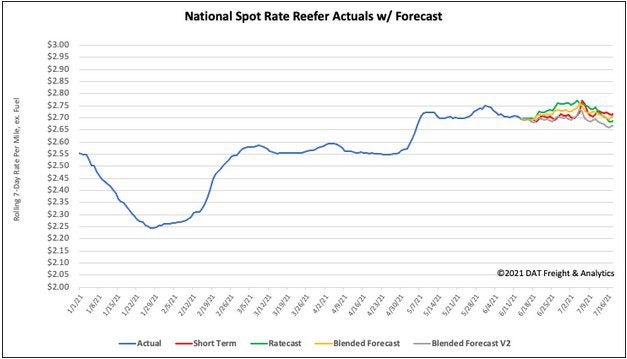
How to interpret the rate forecast:
- Ratecast: DAT’s core forecasting model
- Short Term Scenario: Formerly the pessimistic model that focuses on a more near-term historical dataset
- Blended Scenario: More heavily weighted towards the longer-term models
- Blended Scenario v2: More heavily weighted towards the shorter-term models
> Learn more about rate forecasts from DAT iQ