The ISM Manufacturing PMI rose to 49.1 percent, up slightly from 48.7 in August. The gain came largely from stronger production, but weak demand and shrinking inventories kept the sector under pressure.
The New Orders Index slipped back into contraction at 48.9 percent after one month of growth, suggesting the August rebound was short-lived.
Get the clearest, most accurate view of the truckload marketplace with data from DAT iQ.
Tune into DAT iQ Live, live on YouTube or LinkedIn, 10am ET every Tuesday.
The broader picture remains challenging. ISM estimates that 67 percent of manufacturing GDP contracted in September, with nearly a third of industries in deep contraction. Of the six largest sectors, only petroleum and coal products managed to expand. For now, U.S. manufacturing looks stuck in a shallow downturn—production is holding up, but without stronger orders, the recovery path remains fragile.
Dry van market watch
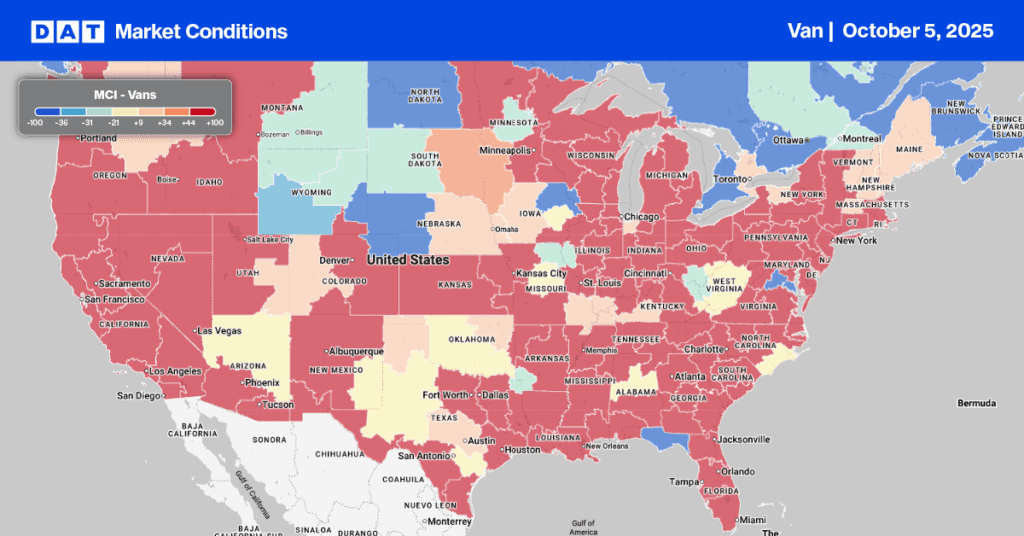
Last week, the dry van load-to-truck ratio rose to 7.67, as load posts increased slightly at month-end and equipment posts dropped by 5%. Brokers faced capacity challenges in California, particularly in the Stockton market, where load posts were up almost 20% week-over-week and overall California load posts increased by 6%. This was due to a decrease in trucks typically arriving from Los Angeles daily, leading to a 10% fall in loads moved on the high-volume Los Angeles to Stockton lane. The significant 17% drop in import containerized volume from Asia during September is likely the direct cause of this short-term capacity imbalance. Approximately 50% of the monthly imports at the Ports of Los Angeles and Long Beach originate in China, a nation currently involved in a trade war with the U.S.
Last week, the Los Angeles to Las Vegas lane experienced an 11% decrease in loads moved, leading to a shortage of dry vans in Las Vegas. This resulted in a 45% surge in outbound load posts from Las Vegas. Similarly, Chicago saw tightened capacity last week, with a 20% jump in load posts and an $0.08 per mile increase in spot rates, averaging $2.20 for outbound shipments.
National linehaul spot rates
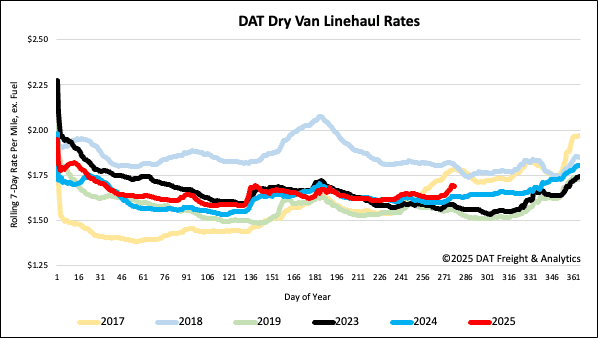
Dry van linehaul spot rates increased by $0.03 per mile last week, averaging $1.70 per mile, $0.05 higher than the same time last year and $0.11 higher than in 2023.
The average rate for DAT’s top 50 lanes by load volume increased by $0.03 per mile last week, averaging $2.01 per mile and $0.31 higher than the national 7-day rolling average spot rate.
In the 13 key Midwest states, which represent 46% of national load volume and often indicate future national trends, spot rates were up $0.05 per mile. Carriers in these states earned an average of $1.92 per mile, which remained $0.22 above the national 7-day rolling average.