The American Trucking Associations’ (ATA) For-Hire Truck Tonnage Index increased 0.4% in October after rising 2.2% in September. This makes it the third month in a row of increasing tonnage. ATA’s index is dominated by contract freight (as opposed to spot market freight) with around 75% of freight volume moving on the contract market in Q3.
Find loads and trucks on the largest load board network in North America.
Note: All rates exclude fuel unless otherwise noted.
“The combination of solid retail sales, inventory rebuilding, and generally higher factory output offset some areas of softer freight growth, like home construction, in October,” says Bob Costello, ATA Chief Economist. “Economic growth remains on solid footing, which is good for truck freight volumes going forward.”
Compared with October 2020, the truckload index increased by 1.8%, which was the largest year-over-year gain since May 2021.
The ever-present port congestion continues
Since the West Coast port congestion reached 40 vessels waiting to unload at the end of February, dry van spot rates on the high-volume Los Angeles to Chicago intermodal lane increased by 73%, or $1.44/mile.
This week’s spot rate for loads on the 2,000-mile haul are averaging $3.41/mile, which is $0.70/mile higher than this time last year when Asian imports began to surge. Truckload volumes on this lane have risen as a result of both higher import volumes and congestion issues being experienced in the intermodal sector. Truckloads moved on this lane are up 155% y/y.
At the start of this week, there were 96 vessels waiting 21 days on average to unload in Los Angeles. It’s more than double the number of vessels waiting to unload in February, and five times more than this time last year.
November import container volumes in the ports of Los Angeles and Long Beach are up a combined 2% since last month, according to IHS Markit PIERS data. This suggests that it’s highly unlikely the backlog of freight waiting to move further inland will clear anytime soon.
Spot rates
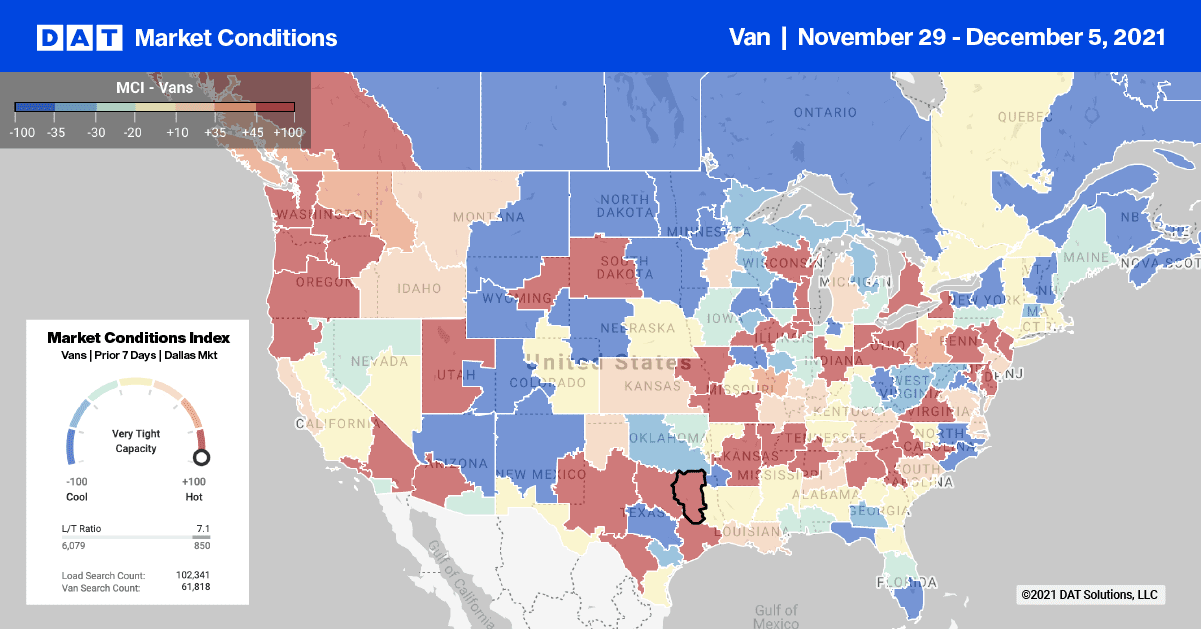
Following the spike in spot rates right before Thanksgiving, capacity eased slightly in the dry van sector last week following a $0.01/mile decrease in the average national rate to $2.60/mile. There’s a noticeably higher amount of load post volume in the market this season.
Last year load post volumes increased by 104% in the first full shipping week after Thanksgiving. This year the increase was 119% week-over-week. Dry van spot rates are still 13% higher than this time last year when rates were around $2.26/mile.
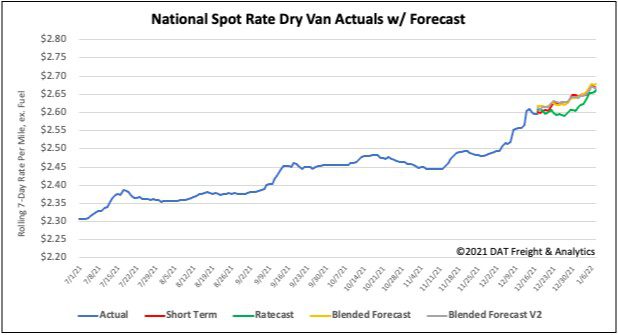
How to interpret the rate forecast:
- Ratecast: DAT’s core forecasting model
- Short Term Scenario: Formerly the pessimistic model that focuses on a more near-term historical dataset
- Blended Scenario: More heavily weighted towards the longer-term models
- Blended Scenario v2: More heavily weighted towards the shorter-term models


