The latest ISM Manufacturing PMI report for October confirms a challenging outlook for truckload carriers, signaling that the “freight recession” is deepening. Manufacturing respondents across nearly all sectors reported a severe lack of demand, with customers actively cancelling or reducing orders due to global and domestic economic uncertainty. This directly translates into less freight on the road. For truckload carriers, this environment means sustained low freight volumes and downward pressure on spot market rates. While any reduction in trucking capacity (bankruptcies) will eventually help the market rebalance, the current data suggests the industry is still squarely facing significant headwinds from softening domestic consumption and business investment delays.
Get the clearest, most accurate view of the truckload marketplace with data from DAT iQ.
Tune into DAT iQ Live, live on YouTube or LinkedIn, 10am ET every Tuesday.
The pervasive tariff and trade war uncertainty remains the most significant business headwind cited by manufacturers, creating chaotic pricing and supply line stress. From a carrier’s perspective, this unpredictability makes it nearly impossible to forecast stable demand. Key customers—especially those in Machinery and Transportation Equipment (like the depressed commercial vehicle market)—are being negatively impacted by both current trade policy and the looming threat of new tariffs. While some manufacturers note that importing is still cheaper than reshoring, the overall turmoil is stalling capital investments and long-term planning, further depressing the need for shipping services. Truckload operators must continue to focus on efficiency, cost control, and strategic planning, as the ISM data provides little hope for a significant peak season or a quick recovery; it suggests a prolonged period of caution and low utilization heading into 2026.

Dry Van Market Conditions Index
In the first week of November, the dry van load-to-truck ratio dropped to 5.83, indicating an easing of spot market capacity. This was primarily driven by a 6% rise in available equipment posts and a 4% decrease in load posts. The market showed noticeable softness, with only six of 135 freight markets reporting slight increases in load post volumes. Notably, load post volume in DAT’s Top 10 freight markets, which account for a quarter of national volume, plunged by 16% last week.
Last week, Atlanta, the top dry van market, saw a 19% drop in volumes and a penny decrease in outbound dry van rates to $1.59 per mile. Houston, the second largest market, experienced a 14% fall in volumes, followed by Chicago with an 11% week-over-week decrease. Dallas volumes plummeted by nearly 30%, leading to a $0.01 per mile drop in outbound spot rates, settling at $1.42 per mile.
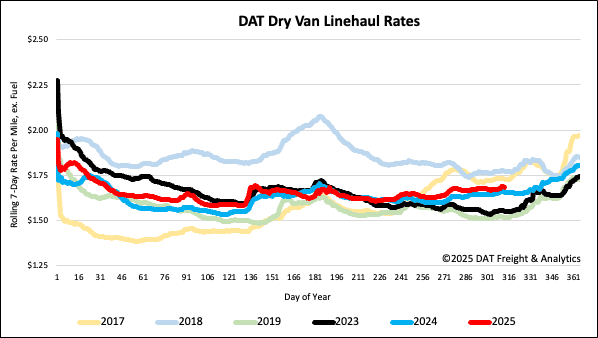
National dry van linehaul spot rates
Last week, dry van linehaul spot rates saw a slight decrease, falling by just under a penny per mile to an average of $1.69. Despite this dip, the current average for Week 45 is $0.03 (2%) higher than the same period last year and $0.02 higher than the three-month trailing average. However, it is $0.02 (1%) lower than the average over the last decade.
The average rate for DAT’s top 50 lanes by load volume dropped by $0.02 per mile last week, averaging $1.98 per mile and $0.29 higher than the national 7-day rolling average spot rate.
In the 13 key Midwest states, which represent 46% of national load volume and often indicate future national trends, spot rates remained unchanged at $1.94 per mile, which was $0.25 above the national 7-day rolling average.