The production of raw steel continues to improve along with capacity utilization for the week ending July 24. The production of domestic raw steel was up 38% year-over-year to 1,868,000 net tons. Capability utilization rate was 84.6%, up from 60.3% a year ago.
Production for the week ending July 24, 2021 is up 0.5% from the previous week ending July 17, 2021. This represents an additional 360 truckloads of steel moved last week compared to the week prior and 20,720 truckloads compared to the same period last year.
Looking at year-to-date numbers, raw steel production is up 18%. That’s the equivalent of an additional 327,640 truckloads moved this year compared to the first seven months of 2020.
The South Region produces 44% of the country’s raw steel, but it’s tonnage was flat last week. However, the Great Lakes Region, which accounts for 34% of production, volumes were up 2%. Production dropped 5% last week in the West Region.
The raw steel production tonnage provided in this report is estimated by the American Iron and Steel Institute. It’s compiled from weekly production tonnage provided by approximately 50% of the domestic production capacity combined with the most recent monthly production data for the remainder.
Find loads and trucks on the largest load board network in North America.
Note: All rates exclude fuel unless otherwise noted.
This week’s release of the IHS Markit Purchasing Managers Index (PMI) signaled the most substantial improvement in operating conditions across the U.S. manufacturing sector on record. The seasonally adjusted PMI recorded 63.4 in July, up from 62.1 in June. This underpins the improvement in the health of the manufacturing sector regarded as the strongest in the 14-year series history.
“July saw manufacturers and their suppliers once again struggle to meet booming demand, leading to a further record jump in both raw material and finished goods prices,” says Chris Williamson, Chief Business Economist at IHS Markit. “Capacity is being constrained by yet another unprecedented lengthening of supply chains, with delivery delays reported far more widely in the past two months than at any time prior in the survey’s history. Manufacturers and their customers are consequently striving to maintain adequate inventory levels, often reporting the building of safety stocks where supply permits, to help keep production lines running and satisfy surging sales.”
For flatbed carriers, this is welcome news as evidence of a cooling housing market started to emerge following a 6% drop in building permits in June.
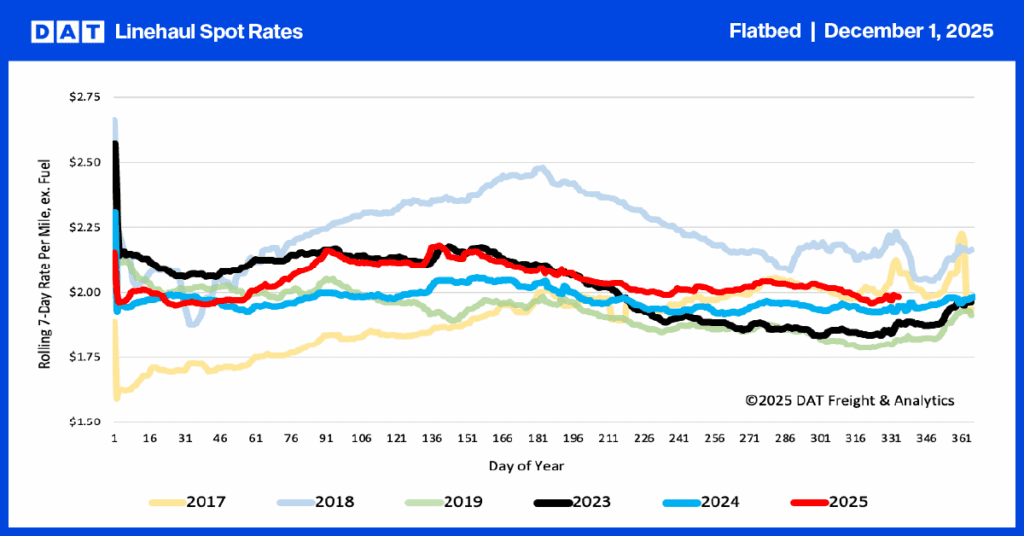
Spot rates
Flatbed spot rates decreased for the fourth week in a row last week, shifting down by $0.01/mile to an average of $2.67/. Flatbed spot rates remain $0.66/mile higher than the same week last year and $0.22/mile higher than the same time in 2018.
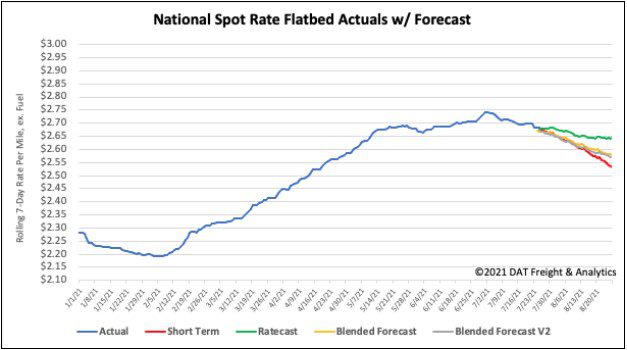
How to interpret the rate forecast:
- Ratecast: DAT’s core forecasting model
- Short Term Scenario: Formerly the pessimistic model that focuses on a more near-term historical dataset
- Blended Scenario: More heavily weighted towards the longer-term models
- Blended Scenario v2: More heavily weighted towards the shorter-term models