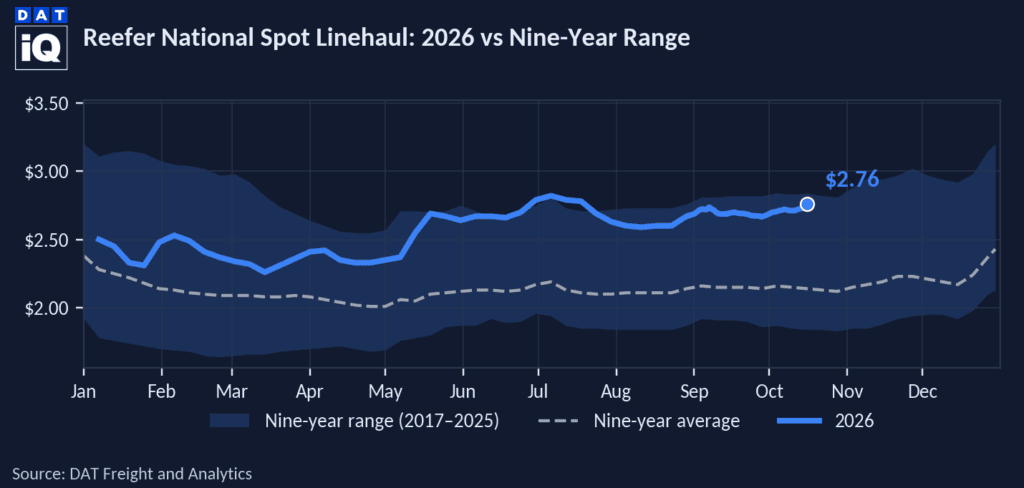
National refrigerated produce volume rose 7% last week and fell 3% from a year earlier, led by a 9% gain in South Texas crossings and a 72% jump in the Imperial and Coachella section. California volume rose 5%, while Washington slipped 5%. The rates in this report are USDA open-market (spot) rates that shippers or receivers pay per load, including brokers’ fees, and they were mixed.
Rate and volume figures come from USDA and cover produce-only refrigerated freight near 34 degrees. Rates are per load and exclude extra charges for terminal-market delivery, multi-pickup, and multi-drop shipments unless otherwise noted.
Get the clearest, most accurate view of the truckload marketplace with data from DAT iQ.
Tune in to DAT Market Update, Mondays at 11am Eastern.
Rates and volume
Rising volume with flat to softer rates reverses the pattern of the week before last, when volume fell 9% and rates firmed on nearly every California lane. Inference: returning freight is absorbing the capacity that tightened the week before last, so the market looks steadier rather than tighter. DAT RateView offers an independent check, with spot rates across all temperature zones and commodity types running about 34% above last year. The two reads differ in scope. The USDA data covers produce-only refrigerated freight near 34 degrees, while RateView spans frozen to fresh.
Cucumber volume rose 22% from the week before, plum tomatoes 30%, and romaine lettuce 21%. Limes fell 18%, cantaloupes 14%, and strawberries 13%. Washington apple and pear lanes lead the rate board at an average 63% above last year, followed by California and South Texas at 38% each. Weekly rate moves were mixed. California and South Texas lane averages were flat, Washington eased 3%, Salinas and Santa Maria into New York gained 17% and 13%, and South and Central California citrus into Seattle fell 16%.
State scorecard

States are ranked by total weekly volume. Rate figures are simple averages of each state’s lane movements. The n/a entries mean no rate lanes were reported.
California
California volume rose 5% and fell 5% from a year earlier. The gain came from the Imperial and Coachella section and from Otay Mesa crossings, which rose 21%, while all five in-state district sections fell. Kern was down 4%, Oxnard 4%, Santa Maria 6%, Salinas-Watsonville 8%, and South and Central 2%. California-region volume, which excludes the Mexico and Arizona crossings, fell 5% and still ran 9% above last year. The weakest commodities were cantaloupes (down 26%), peaches (down 28%), watermelons (down 32%), and Salinas iceberg lettuce (down 41%). Iceberg loading is also shifting from Salinas to the Central San Joaquin Valley, which held 38% of California iceberg volume last week, up from 1% the week before last.
Farm labor context. Growers and a labor contractor in the Central Valley and on the Central Coast report workers staying home amid stepped-up immigration enforcement, according to an October 21 report. The Los Angeles Times reported on October 14 that DHS confirmed general enforcement activity without disclosing its scope. A Madera-based fig grower said about half of roughly 100 harvest workers had been absent for more than a week and that the farm could not fill all of its fresh-fruit orders. A labor contractor employing about 3,000 people described sharply lower turnout on some crews. None of this is a statewide measure, and the AgTransport export does not break out figs.
Inference: the melon, peach, and watermelon declines look like seasonal wind-down, and the data cannot separate labor from season. Enforcement may be one factor in the in-state decline but is not shown to be the cause. A delayed load can ship later, while an unharvested crop creates no replacement load, so a rebound in coming weeks would point to delay and a persistent gap would point to lost volume.
Inference: fewer outbound loads would normally pull on lane rates, but California lanes did not move together last week. The lane average was flat and 38% above last year, Salinas and Santa Maria into New York rose 17% and 13%, and Santa Maria into Miami fell 9%.
Imperial and Coachella Valleys, Arizona, and Mexico crossings
Volume through the section rose 72% and fell 46% from a year earlier. Calexico and San Luis crossings rose 33%, led by green onions (up 49%) and asparagus (up 45%). Arizona crossings, led by Nogales, rose 71%, with cucumbers up 103%, watermelons up 198%, honeydews up 464%, and tomatoes up 19%. The Imperial, Coachella, and Palo Verde production districts recorded sweet corn volume after none the week before last, 90% below last year. Inference: the winter desert vegetable deal is starting but has not yet reached last year’s volume. Rates split across nine lanes, with four up, two flat, and three down. Dallas gained 4%, while Chicago fell 5% after jumping 13% the week before last.
South Texas crossings
Volume rose 9% and 1% from a year earlier. Pharr, the largest crossing, rose 5%, Laredo rose 22% but fell 17% from a year earlier, and Roma slipped 1%. Avocados, the biggest line, rose 8%, while plum tomatoes rose 36%, tomatoes 28%, and bell peppers 27%. Limes fell 20%. Rates reversed the pattern of the week before last. Atlanta fell 3% and Miami 5% after rising 14% and 7%, while Boston gained 7% and New York 5%. The lane average was flat and runs 38% above last year.
Washington
Volume fell 5% and rose 1% from a year earlier. Apples fell 4% and pears 10%. Rates eased on seven of ten lanes after holding flat on every lane the week before last, though all ten still run 27% to 95% above last year.
North Carolina and Delmarva
North Carolina volume fell 12% and is now entirely sweet potatoes. Delmarva volume fell 38% from a small base. USDA has issued its last watermelon rate reports for both, so neither state has rate lanes in this report.
What this means for carriers, shippers, and brokers
Carriers: The best money stays in Washington apples and pears, where Yakima and Wenatchee into Miami runs 71% above last year and Dallas 93% above, though seven of ten lanes eased 1% to 7% and volume fell 5%. Momentum is on the California coast, where Salinas and Santa Maria into New York gained 17% and 13%, South and Central citrus into Dallas rose 11%, and vegetables into Chicago rose 9%. The most new volume is in the desert and at the crossings. Be cautious on Santa Maria into Miami (down 9%), Seattle (down 8%), and Dallas (down 7%), and on South and Central citrus into Seattle (down 16%). Takeaway: steer trucks toward the coastal New York lanes and the rising Imperial lanes, and hold price discipline on Washington freight, where rates sit far above last year but have started to give.
Shippers: Budget for a market well above last year on every comparable lane group. California lanes average 38% above 2025, South Texas 38%, and Washington 63%, even though the California and South Texas averages were flat. Softening is real but narrow. Washington into New York and Atlanta fell 7%, though they remain 46% and 57% above last year, and South and Central citrus into Seattle fell 16% and into Baltimore 4%. Flexibility on the receiving point is where the savings sit. Out of Imperial, Philadelphia runs about 3% below Baltimore and about 7% below New York at the midpoints. Out of Santa Maria, Philadelphia runs about 25% below New York, and out of South and Central California, vegetables into Philadelphia run about 18% below New York. Inference: because rates sit this far above last year and eased only at the edges, waiting carries more risk than covering. Takeaway: price Philadelphia against Baltimore and New York before you book, and cover your highest-volume lanes early.
Brokers: The week splits into freight to price up and freight to buy down. California coastal freight into New York is the price-up side. Salinas rose 17% and Santa Maria 13%, so quote that business with room and expect carriers to hold out for more. Washington is the buy-down side, with seven of ten lanes lower, as are South Texas into Miami (down 5%), Baltimore (down 3%), and Atlanta (down 3%), and Imperial into Chicago (down 5%). South Texas into Boston (up 7%) and New York (up 5%) is the exception, where carriers hold leverage. Takeaway: lock carrier commitments on California coastal New York freight now, and buy Washington and South Texas southeast loads on the day.
About these rates
Rates are for Tuesday, October 20, 2026. Week-over-week changes are USDA’s printed changes from Tuesday, October 13, 2026. Year-over-year changes compare the midpoint of each lane’s mostly range with the same origin district and destination city in the USDA report for Tuesday, October 21, 2025. Rates are open (spot) market sales that shippers or receivers pay, depending on the basis of sale, per load, including brokers’ fees, for truckload shipments to a single destination in 48-53 foot refrigerated trailers. Volumes are USDA AMS AgTransport reported refrigerated truck movement of fresh fruits and vegetables, and the report shows only percentage changes.