The tide is definitely turning for containerized imports as more volumes arrive on the East Coast of the U.S. compared to the West Coast. The backlog of loaded container vessels has dropped rapidly off the coast of Los Angeles (down from 109 on 9/1/22 to just 45 vessels at-anchor as of last Friday) as length unloading delays shift to the East Coast where there are around 15 vessels anchored off the Port of Charleston and another eight outside Savannah.
According to IHS Markit PEIRS, Mach import volumes were up 3.26% y/y on the East Coast but down 8.35% y/y on the West Coast as importers redirect containers to any port not named Long Beach or Los Angeles. The big beneficiaries of the coastal shift on the East Coast have been South Carolina Ports (SC Ports), which has just reported an all-time container record in March, marking the 13th consecutive month of cargo records at the Port of Charleston. Strong U.S. consumer appetite for retail goods continues to drive record cargo levels, with imports up 16% year-over-year in March. SC Ports is responding to the record volumes and ongoing supply chain challenges in real-time with a variety of efforts, such as providing Sunday hours for motor carriers and selective term leasing of the port’s new chassis.
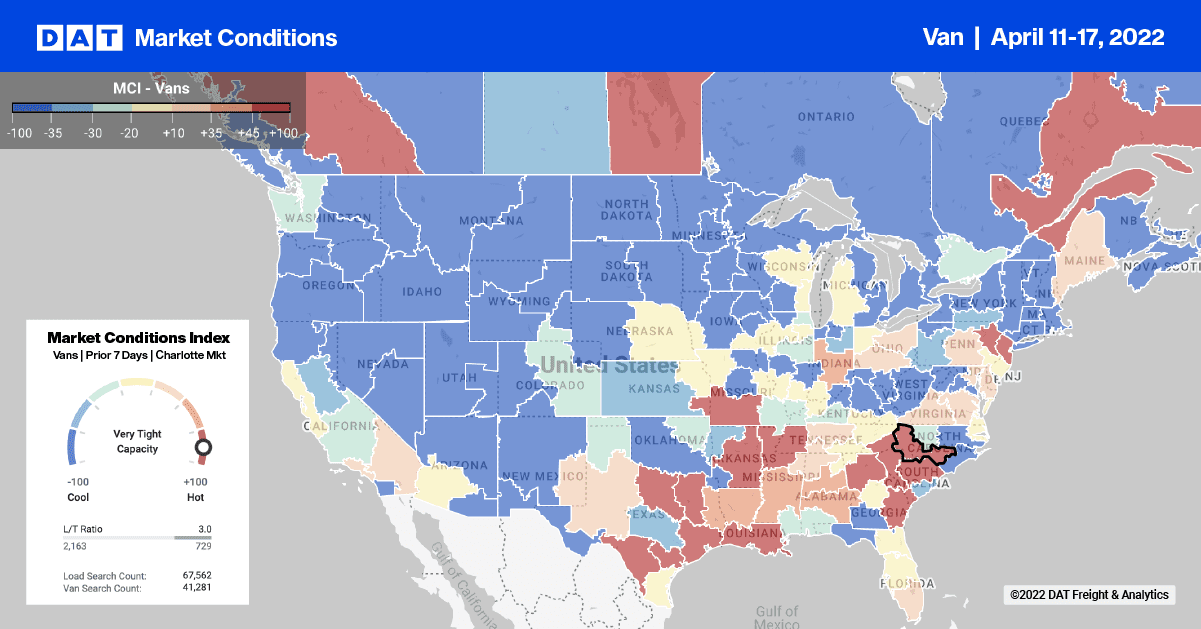
SC Port shippers are finding plenty of available dry van capacity despite record-high import volumes as spot rates continue to decrease. Rates dropped by $0.04/mile last week to an average outbound rate of $2.45/mile excl. FSC – that’s down by $0.21/mile in the previous month. Capacity on the popular short-haul lane west to Atlanta also loosened, with rates dropping by $0.38/mile since March to an average of $2.93/mile excl. FSC or exactly where they were this time last year.
On the West Coast, the volume of loads moving between Los Angeles and Chicago dropped by 11% w/w, resulting in dry van spot rates plunging even further last week. At an average of $1.93/mile excl. FSC, spot rates on this 2,000-mile lane are now $0.48/mile lower than the previous year and down an impressive $1.36/mile since the peak of $3.29/mile excl. FSC last December. Trucker protests on the southern border following the introduction of additional screening of every truck last week drove up spot rates by around $0.30/mile to an average of $2.10/mile excl. FSC for loads between Laredo and Los Angeles. Loads east to Atlanta were up but only slightly increasing by $0.04/mile to an average of $2.66/mile excl. FSC.
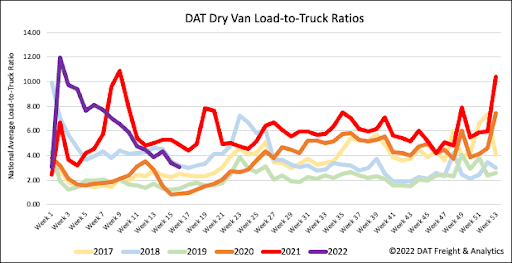
Dry van load post volumes are now 30% lower than last year but higher by the same amount compared to 2018 levels. The rapid loosening of capacity resulting in equipment posts at 2019 and 2020 levels is of more concern. Last week’s load-to-truck ratio (LTR) dropped another 11% w/w from 3.41 to 3.02 and is now at the same level as this time in 2018 again.
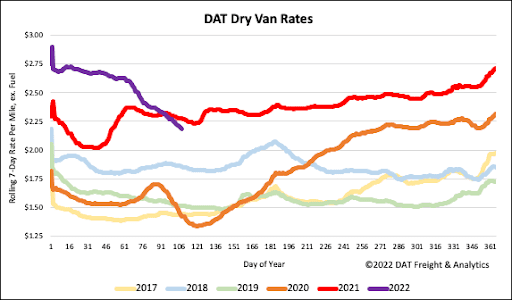
Dry van spot rates dropped another $0.06/mile last week to a national average of $2.22/mile excl. FSC. They’ve been dropping by the same amount each week for the previous month with no sign of slowing down. Spot rates have now dropped by $0.56/mile since the start of the year ending and are around $0.33/mile higher than this time in 2018.


