The ACT For-Hire Trucking Index for June indicates a continued downturn in the industry, marking the fourth consecutive month of soft volumes and persistent overcapacity. Despite some potential for near-term improvement, several factors are prolonging the challenging environment for carriers. The Volume Index in June registered 41.5 (seasonally adjusted), a slight decrease from 42.5 in May. This sustained weakness is primarily due to tariff-related effects, specifically the quickly rescinded April tariffs and the ongoing issue of overcapacity within the for-hire sector.
Get the clearest, most accurate view of the truckload marketplace with data from DAT iQ.
Tune into DAT iQ Live, live on YouTube or LinkedIn, 10am ET every Tuesday.
The Supply-Demand Balance decreased to 44.4 (seasonally adjusted) in June from 46.1 in May. This shift is a direct result of declining volumes and increased capacity, leading to a looser market balance as tariffs took effect. While near-term demand is anticipated to improve, the market is poised to enter a payback period following multiple instances of freight pull-forwards. Even with modest pass-through, the inflationary effects of tariffs are likely to contribute to continued softness in goods demand in the coming months.
The supply-demand balance is expected to remain at or below 50 in the near term, as the impact of tariffs on demand continues to counteract ongoing declines in capacity.
Load-to-Truck Ratio
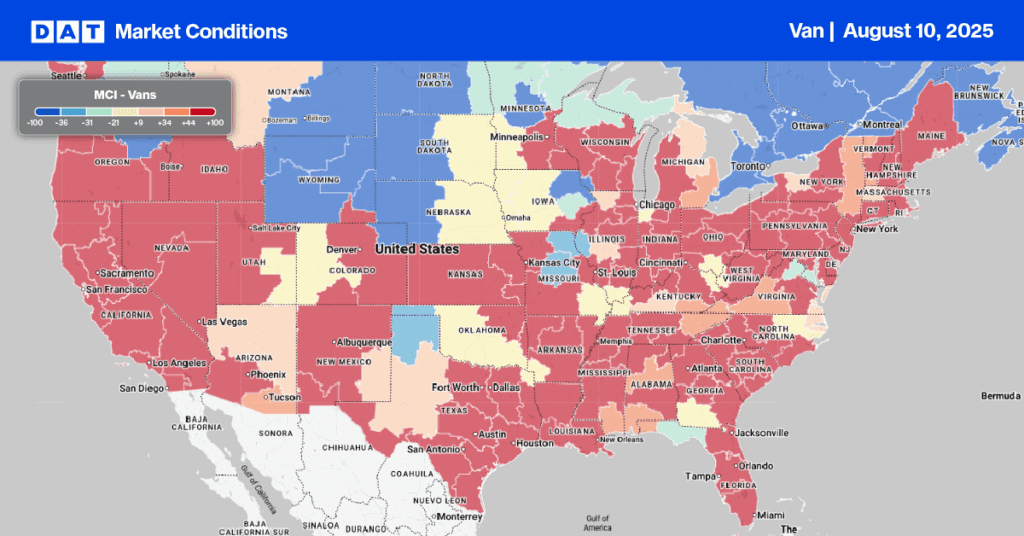
After a significant surge in volume at the end of last month, the market began to cool in August. Load posts decreased by 15% last week, though they remain 7% higher than the previous year. This coincided with a slight reduction in carrier equipment posts, leading to a dry van load-to-truck ratio of 5.67.

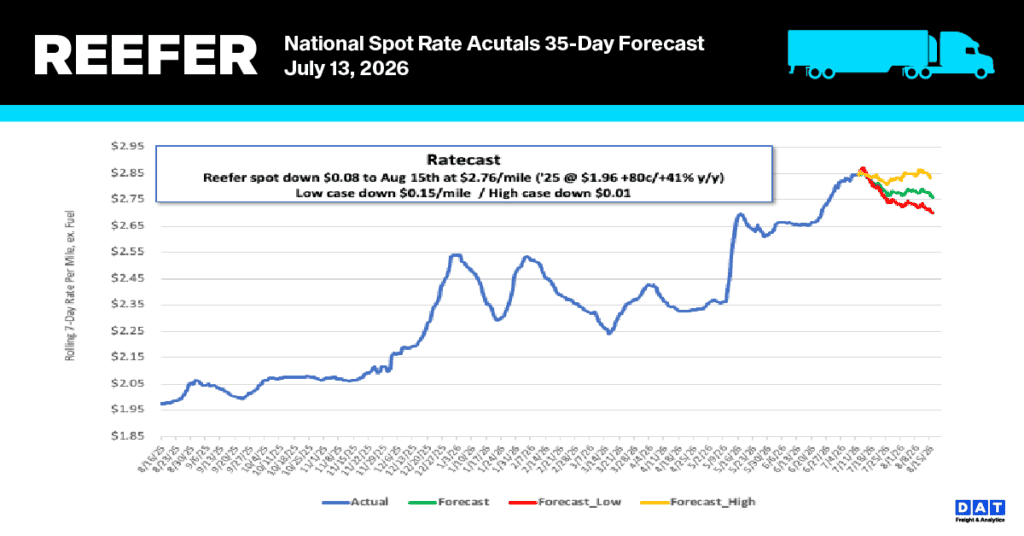
Linehaul spot rates
After remaining flat during the second half of July, dry van linehaul spot rates started August down a penny, averaging just over $1.64 per mile, but $0.02 higher than the same time last year and $0.05 higher than in 2023.
The average rate for DAT’s top 50 lanes by load volume remained unchanged at $1.99 per mile and $0.35 higher than the national 7-day rolling average spot rate.
In the 13 key Midwest states, which represent 46% of national load volume and often indicate future national trends, spot rates were up a penny on a 17% lower volume of loads moved. Carriers in these states earned an average of $1.87 per mile for the second week, which is $0.23 above the national 7-day rolling average.