In August 2025, U.S. containerized import volumes declined 7.6% month-over-month at around 2.7 million twenty-foot equivalent units (TEUs), marking a slight year-over-year decline of about 3% compared to August 2024, according to data from S&P Global (PIERS).
Get the clearest, most accurate view of the truckload marketplace with data from DAT iQ.
Tune into DAT iQ Live, live on YouTube or LinkedIn, 10am ET every Tuesday.
August saw a significant drop in imports from China and other major suppliers, down 2% month-over-month and 5% year-over-year. This followed a record-high surge in July, driven by front-loading ahead of earlier tariff changes. The decline reflects ongoing trade uncertainties, the impact of tariffs, and supply chain adjustments as importers manage inventory levels after the front-loading period. Despite this moderation, import volumes remain historically strong compared to pre-pandemic levels, but could mean a substantial fall-off in volume later in the year is imminent.
U.S. container volume is projected to experience a significant 17.5% decline in the remaining five months of 2025, primarily due to tariffs, according to global shipping expert John McCown. This anticipated drop marks one of the most substantial year-over-year changes in the six-decade history of U.S. container shipping. Historically, annual declines have been rare, limited to the financial crisis and the pandemic, both of which were brief.
In contrast, total U.S. inbound volume in 2024 actually exceeded the 2022 peak pandemic volume. However, current data indicates a notable shift of inbound volume toward North American ports (Mexico and Canada), away from U.S. ports. The downturn expected in 2025 is attributed solely to tariffs, and unfortunately, there are no current signs of this trend being short-lived. It appears increasingly likely that significant tariffs will persist for at least the duration of the current administration.
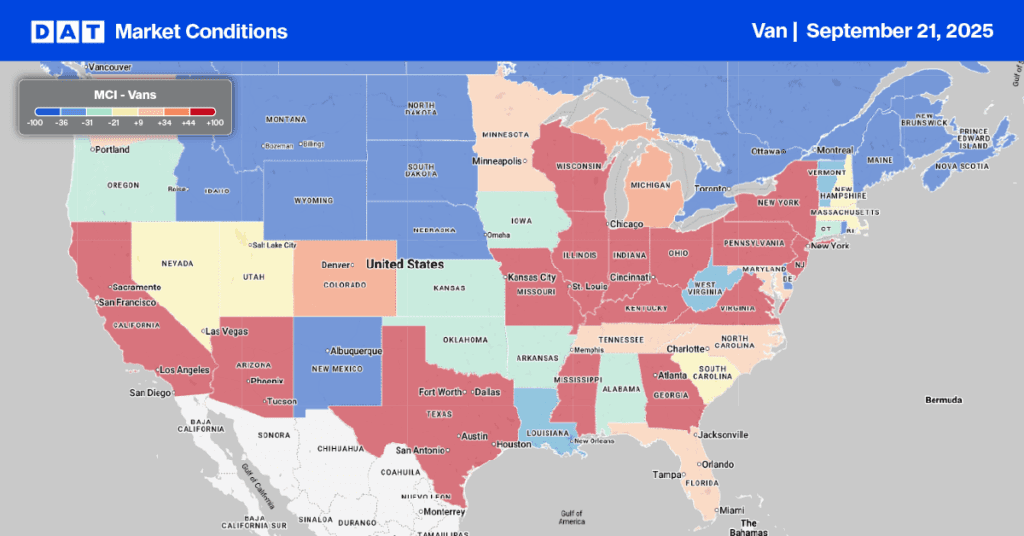
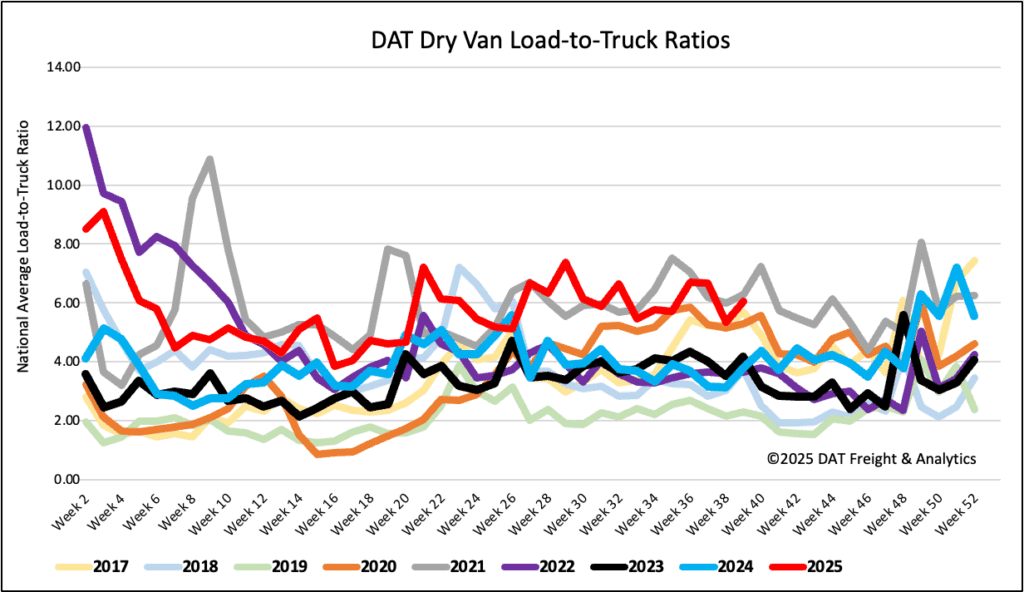
Load-to-Truck Ratio
Dry van load posts saw another 6% increase last week pushing volumes almost 40% higher than this time last year and 11% higher than the long-term pre-pandemic average for Week 38. Carrier equipment posts fell 6% resulting the dry van load-to-truck ratio settling at 6.05 last week.
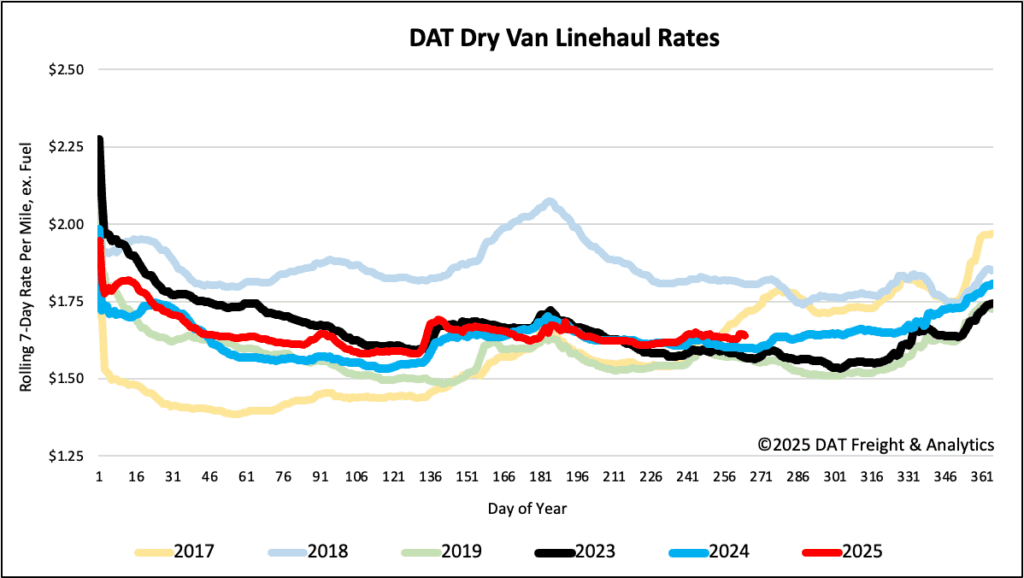
Linehaul spot rates
Dry van linehaul spot rates dropped by just over $0.01 per mile last week, averaging $1.65 per mile, $0.04 higher than the same time last year.
The average rate for DAT’s top 50 lanes by load volume remained decreased by another $0.02 per mile last week, averaging $1.99 per mile and $0.34 higher than the national 7-day rolling average spot rate.
In the 13 key Midwest states, which represent 46% of national load volume and often indicate future national trends, spot rates were down $0.04. Carriers in these states earned an average of $1.87 per mile, which remained $0.22 above the national 7-day rolling average.