The U.S. Bank National Shipments Index experienced a 2.9% decline in the third quarter, negating the 2.4% gain from the previous quarter. This downturn suggests a continued weakening in the freight sector. Shipment volumes have decreased by over 40% since late 2020, with the majority of this reduction occurring in the last two years. With the exception of the second quarter of this year, every quarter for the past three years has seen a drop in shipment volumes.
Get the clearest, most accurate view of the truckload marketplace with data from DAT iQ.
Tune into DAT iQ Live, live on YouTube or LinkedIn, 10am ET every Tuesday.
Year-over-year comparisons also show a significant decline, with a 10.7% decrease in shipments during the third quarter, a steeper drop than the 9.8% reduction observed in the second quarter. For the year to date, volumes are down 11.5% compared to the same period in 2024.
Freight volumes have faced persistent challenges for years, aggravated by a deceleration in the goods economy during the summer and early fall. Tariffs, especially on essential unfinished goods for manufacturing, are negatively affecting U.S. factory output. Most manufacturing indicators show minimal growth, subsequently impacting trucking freight. Housing construction also experienced a slowdown in Q3, with reduced spending on both single-family and multi-family homes, even with lower mortgage rates. Although household goods spending remained steady, overall discretionary spending decreased, pointing to a broader economic slowdown.

Dry Van Market Conditions Index
Last week, dry van load and equipment post volumes remained relatively stable, resulting in a load-to-truck ratio of approximately 5.4 by the end of the week. However, some regional markets saw increases. On the West Coast, the major markets of Stockton and Ontario reported higher load post volumes, up 5% and 7% respectively. Similarly, Mid-Atlantic markets in the Carolinas experienced about a 5% increase in load post volumes.
Dry van capacity in Charleston, WV, was notably constrained, causing spot rates to climb by $0.21 per mile to reach $2.06 per mile. Load post volumes surged by 66% last week. Regional loads heading east to Baltimore saw rates as high as $3.52.
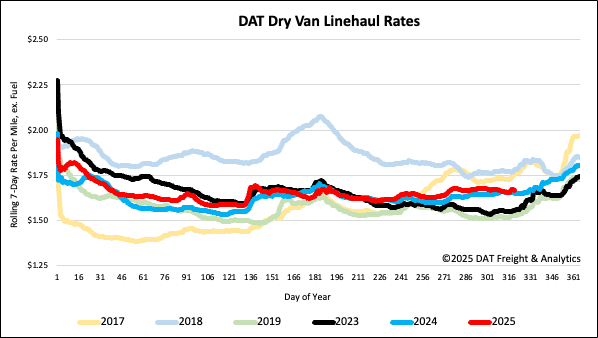
National dry van linehaul spot rates
Spot dry van linehaul rates fell by $0.02 per mile last week, settling at an average of $1.68 per mile. This rate is just $0.01 higher than the same week last year, a marginal increase of less than 1%.
The average rate for DAT’s top 50 lanes by load volume dropped by $0.03 per mile last week, averaging $1.97 per mile and $0.29 higher than the national 7-day rolling average spot rate.
In the 13 key Midwest states, which represent 45% of national load volume and often indicate future national trends, spot rates decreased by $0.03 per mile to $1.91 per mile, which was $0.23 above the national 7-day rolling average.